


Note: Includes April 5 and further updates sections below.
Please refer to the previous post, A Logical Perspective Continued. Corona virus 2020 Update for a full discussion on the subject, which began here 3 articles and over one month ago.
The data has begun coming in, the data that will help prove or disprove what has been claimed here all along.
As it becomes available however, it seems unbelievable that more members of the media are not picking up on this. Is the public?
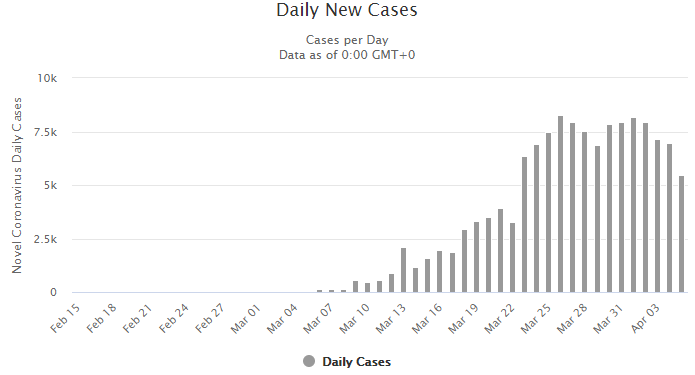
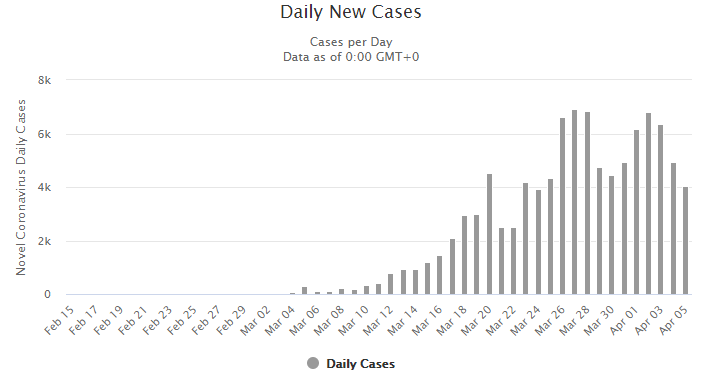
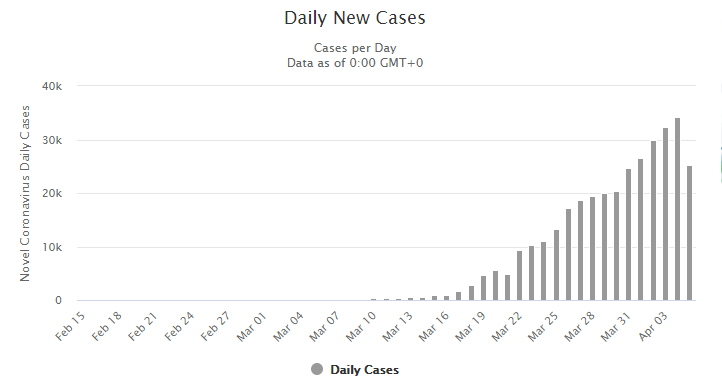
Does anyone notice that we are watching our own growing test curves in panic? Take the latest US daily figures.
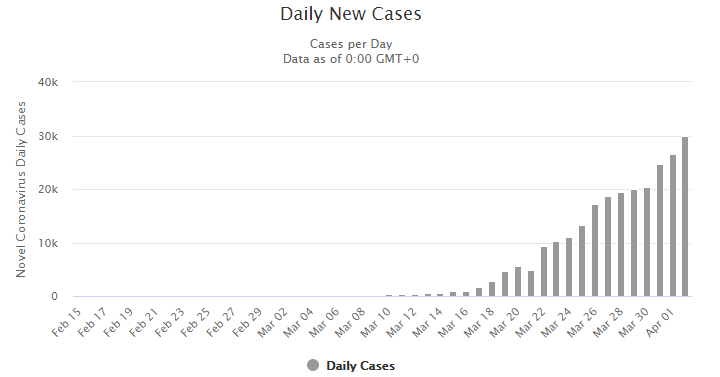
The is US is reporting having ramped up to 100 thousand tests per day, and about 30 thousand new COVID-19 cases per day. That is 30% of the tested population! If numbers are anywhere near correct, it is shocking.
The data is very spotty, since states such as California are reporting significant backlogs as well. Many people are still waiting days to receive their results. However, if they are anywhere in the ballpark, that is daily positive test results compared to the daily test rate, the results are striking. And unless daily test results are a “catch up” of several previous days of testing (which is unlikely since we see the daily confirmed cases steadily and smoothly rise along with the increased testing), that percent can only be higher. For example, if the results on the whole represent tests administered 4 days ago, the number we used with a very nice fit earlier in our data, then while testing may be at 100 thousand per day today, it could have been at 70 thousand per day at that point; making the more than 30 thousand confirmed cases found more than 43% of the tested population instead of 30%!
In any event, for the moment let us grant that confirmed cases today corresponded to the reported current daily test rate of 100,000 per day. That 30% of the tested population would translate to 98 million cases in the US! Even 10 times less, to account for symptomatic people being tested more (keep in mind we know that about 50% of cases are asymptomatic), is 9.8 million cases active in the population NOW vs. the 245 thousand or so total cases ever claimed. What arrived late to the US is testing, not the virus.
Please note that interestingly, this 3% figure, would match the early serology test results announced by San Miguel County mentioned in our previous April 1 Update. It is reasonable to expect however, a much higher percent in other urban areas around the country.
The US last? California last? I don’t think so.
The idea that SARS-CoV-2 arrived virtually last out of industrialized nations to the United States is interesting. The virus as far as we know, originated in Asia, apparently Hubei province China, and spread from there. Wuhan, Hubei province’s capital city and where the first cases were officially recorded, is (or was) China’s 14th busiest airport and the busiest of central China. It has many domestic flights to all of China’s major airports and many other major Asian hubs. Through one connecting flight, it is connected to much of the world.
However, it also has an impressive number of direct flights to major international destinations, themselves major international hubs.
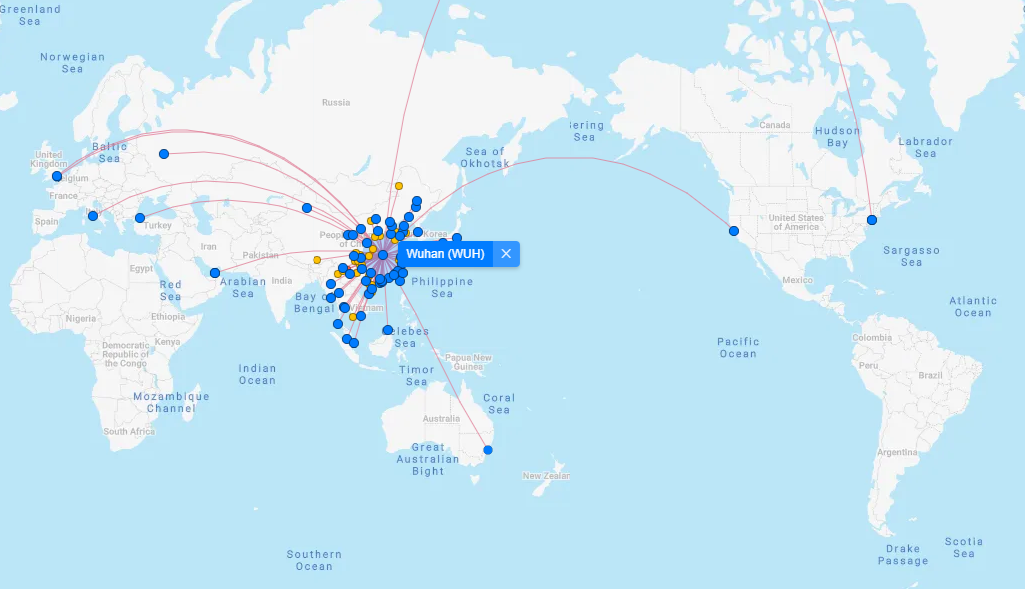
Note that Europe is not particularly better represented than the US (especially since this map above is missing the significant Anchorage, Alaska route). London and Rome are the only destinations in Western Europe, and further east there are direct flights to Moscow and Constantinople. To the US, we have direct flights to the major hubs that are SFO and JFK, on either coast. There are also direct flights to Alaska, and note that most of the major Asian destinations from Wuhan, such as Tokyo, Singapore, Seoul and Sydney, have major high-traffic routes connecting to the US, especially to its west coast airports such as LAX, SFO and SEA (Seattle-Tacoma).
First let’s take a look at its outgoing flights to some of the busiest international Chinese hubs. Note that Beijing for example, by 2019 was the world’s second largest airport (by passenger traffic), Shanghai the 8th, and Guangzhou the 12th. From these hubs, much of the world is at easy reach, foremost and not least, the USA.
| Destination | Nov-19 | Dec-19 | Jan-20 | Feb-20 |
| Beijing | 477 | 493 | 356 | 7 |
| Shanghai | 450 | 464 | 331 | 10 |
| Chengdu | 378 | 389 | 308 | 9 |
| Guangzhou | 337 | 346 | 286 | 4 |
The number of monthly flights through January 2020 to these cities is staggering, and helps explain how much the world was easily inculcated to begin with (if indeed the virus did start in Wuhan as it is currently thought).
Let’s see what that translates to in terms of passengers. We estimate this by the typical passenger capacity of specific planes.
| Plane | Passenger Capacity (all classes) |
| A319 | 160 |
| A320 | 150 |
| A321 | 200 |
| A330 | 335 |
| A332 | 253 |
| A333 | 440 |
| B732 | 136 |
| B733 | 149 |
| B735 | 132 |
| B736 | 149 |
| B738 | 189 |
| B744 | 568 |
| B77W | 309 |
| B788 | 224 |
| B789 | 297 |
| GLEX | 20 |
For some, the numbers used are corresponding to specific configurations as given by the corresponding airlines. For example, China Southern Airlines reports that their B77W (short for the Boeing 777-300ER ) seats a total of 309 passengers (all classes combined). Still, these are approximate estimates as configurations can vary from time to time and airline to airline, and even more importantly of course, not all flights are filled to capacity. However, for purposes of getting an idea of relative capacities and destination popularity, this will suffice.
| Destination | Nov-19 | Dec-19 | Jan-20 | Feb-20 |
| Beijing | 95,997 | 94,579 | 64,519 | 700 |
| Shanghai | 79,556 | 81,981 | 57,249 | 1,000 |
| Chengdu | 67,347 | 69,698 | 54,016 | 900 |
| Guangzhou | 66,652 | 67,828 | 54,354 | 489 |
We can see that the transit out of Wuhan well into January was massive, within China and to its major international hubs. This is of course independent of the massive rail and road transit that occurs daily within China. As a factory manager told me in a recent visit to mainland China, the high-speed rail system has made China “small”. A flight is a big deal for the average Chinese citizen, but the high speed trains made the massive country feel smaller and more connected. Workers could suddenly visit their families back home and be back to work shortly without issue.
In any event, the total commercial flights out of Wuhan (not counting incoming flights) were:
- 8,043 in November 2019
- 8,281 in December 2019
- 6,295 in January 2020
- 131 in February 2020
Below are some of the international direct flights. By number of flights and by passenger capacity once again.
| Destination | Nov-19 | Dec-19 | Jan-19 | Feb-20 |
| Bangkok | 143 | 157 | 107 | |
| Hong Kong | 52 | 49 | 35 | |
| Tokyo | 52 | 53 | 48 | |
| Singapore | 48 | 53 | 34 | |
| Seoul | 35 | 38 | 25 | 4 |
| Dubai | 16 | 16 | 12 | |
| Paris | 14 | 13 | 10 | |
| Anchorage | 13 | 6 | 7 | |
| Moscow | 13 | 13 | 13 | 2 |
| Sydney | 13 | 13 | 10 | |
| San Francisco | 13 | 13 | 11 | 1 |
| New York | 13 | 13 | 10 | |
| London | 13 | 13 | 10 | |
| Rome | 13 | 13 | 11 | 2 |
| Istanbul | 13 | 13 | 10 |
| Destination | Nov-19 | Dec-19 | Jan-20 |
| Bangkok | 24,609 | 26,826 | 18,390 |
| Hong Kong | 11,018 | 9,390 | 6,550 |
| Tokyo | 6,951 | 6,951 | 6,185 |
| Singapore | 11,807 | 12,073 | 8,291 |
| Seoul | 10,693 | 11,611 | 7,801 |
| Dubai | 3,584 | 3,584 | 2,688 |
| Paris | 3,309 | 3,289 | 2,530 |
| Anchorage | 7,384 | 3,408 | 3,976 |
| Moscow | 4,355 | 4,355 | 4,355 |
| Sydney | 3,289 | 3,289 | 2,530 |
| San Francisco | 3,945 | 4,017 | 2,981 |
| New York | 3,861 | 3,861 | 2,970 |
| London | 2,912 | 2,912 | 2,240 |
| Rome | 2,912 | 2,912 | 2,464 |
| Istanbul | 2,912 | 2,912 | 2,240 |
Firstly it is important to note that the international travel out of Wuhan to major airports is small compared to the domestic to cities such as Beijing, Shanghai, Chengdu, and and Guangzhou for example (as seen above). The infection rates there must have been high as well, despite Chinese silence on the issue. And those cities are very well connected to the world, and to the US. United Airlines alone has direct flies to 3 of them, Beijing, Chengdu and Shanghai to their San Francisco hub airport, SFO. China Southern Airlines flew directly from the fourth, Guangzhou (not to mention from Wuhan itself) to SFO as well. Not surprisingly, LAX, boasted several airlines flying direct routes to and from all four. And therefore, it is important to note that the first reported US confirmed case, involved a gentleman who had visited Wuhan and returned to the US on a non-direct flight.
Regardless, let us examine some of these direct international routes. Bangkok was clearly the largest international recipient of direct flights from Wuhan. It is no surprise that Thailand was the first country that confirmed a covid19 case outside of China (around Jan 13). Given the infection rates in Hubei Province, this was most likely very far from the first case. Thailand has no direct flights to the US, in part due to the FAA downgrading Thailand’s Safety rating in 2015. Bangkok, nonetheless is served by two major international airports that easily connect it to the rest of the developed world including of course to any major airport in the USA.
The remaining cities on the list, from Hong Kong, Singapore and Seoul to London and Rome are all very well connected to major US airports. Thailand detected a case first, likely for little reason other than being on the lookout earlier due to the awareness of the heavy traffic from Wuhan directly.
The US meanwhile, seemed to ignore the much heavier traffic it enjoyed with Wuhan indirectly, as well as the actual direct flights from Wuhan which also far outweighed those to Thailand in comparison. A similar situation emerged with Australia, due to the awareness of the Wuhan to Sydney direct route.
Note that after the 3 large Asian destinations, the next heaviest route was Anchorage, Alaska. The majority of these folks of course were traveling onward to other US cities. No other European city came close such volume from Wuhan in November, and only far off Moscow did so in the subsequent two months.
In addition to Anchorage, note that passenger volume (or at least capacity) was heavy for San Francisco and New York (with San Francisco, surpassing New York) with nearly 4,000 travelers from Wuhan each during November alone. Rome and London are far lighter routes all through Jan 2020.
Combined, for January 2020, when the outbreak was already going strong, direct flights to the US from Wuhan included roughly a 9,927 passenger capacity. For the European Schengen Area (a single travel jurisdiction of 26 European states), it was a much lower 4,994 capacity (and still lower at 7,234 even if we include London).
For the Schengen Area’s population of about 420 million people, that is one passenger from Wuhan for every 84,100 people. For the US with its 327.2 million people, it means one passenger from Wuhan for every 32,960 people. Quite a bit more.
The idea that this virus moved from Wuhan to the rest of east and southeast Asia (but somehow avoided the Asian gateway hubs in the Pacific coast of North America), then to Europe (in alpine places like Tuscany, Lombardy, Switzerland and Luxembourg followed by Germany, Austria and only later the UK and Scandinavia), and then finally the US through its European gateway of New York of course is a fantasy.
The total Chinese visitors to the US in 2018 were nearly 3 million, according to the National Travel and Tourism office (a decline from 2017). For Europe, the numbers are a bit trickier due to the various countries involved. If Chinese data is to be believed, there was 5.5 million tourists to the Schengen Area in 2018, but there was also more than 12 million Chinese visitors in 2015. Like most data coming out of China, it is meant to increase the People’s Republic’s influence abroad, and not to be accurate. European leaders believe it at their peril (at least at the risk of being played for fools). This interesting article, steeped in the style of not blindly believing all data governments throw at you (like what we do here), concludes with an estimate that about 3.1 million Chinese visited the Schengen Area in 2018 (3.3 million if you include the UK). The writer grants that even this may be an overestimation of the visitor numbers to Europe, because the larger immigrant and foreign student population in the US is likely to produce more visits per Visa (more return visits) than is in the case in Europe, and in this estimation the same ratio was used.
Anecdotally, in some of my recent trips to Europe, I noticed in certain places that the amount of Chinese signage, which was everywhere, did not seem to correlate with the number of Chinese tourists present. Sure, there were some, but far fewer than other nationalities, individually and certainly in combination, and other seemingly more obvious languages were not as represented. Thought it could be a seasonal issue, but perhaps as the writer points out, businesses and municipalities were misled by the EU and Chinese data.
In either case, once gain, 3.1 million to 3.0 million, when the former is a rough estimate, is about the same, and considering the 420 million Shengen Area population, the US “per capita” Chinese visit is significantly larger.
The virus was likely in the US just as fast as it was in any other of China’s Asian neighbors. And cases continued of course to be exported from the US and into the US to and from European destinations, and the rest of the world. Once we have the virus in major hubs like SFO, LAX and JFK, the spread would be lighting fast.
The Schengen Area of Europe, for all its fanfare, is nowhere near as interconnected as the domestic US market. The domestic US market continues to be the largest single air-travel market. The amount of travel and commerce within the US still far outstrips that between the different nations of the European Schengen Area.
LAX is the third busiest airport on earth by traffic, with Beijing in second place and ATL in Atlanta, Georgia in the number one spot. O’Hare in Chicago, Dallas/Forth Worth and Denver all earned top spots in 2019 numbers. Noteworthy is that JFK, while still relatively large on the world stage is far lower at the 21st spot, closely followed by San Francisco’s SFO in 24th place.
So not only as it unlikely that the US “was last”, but also that the earliest main gateway for the virus into the US was through New York (despite Gov. Cuomo’s explanation that they “Welcome People”), and thus California was “last among last”, still waiting for the impact. We have seen that the gateway to Asia is the West Coast. Those same airports are also well connected to Europe and the rest of the world. And regardless of which city had a significant number of cases early on in the US, they would at very least quickly spread to the other major hubs.
The busiest single air route in the US is JFK-LAX, followed by SFO-LAX. The combined air travel volume that was available and occurred during these months from Asia to Los Angeles, San Francisco, Seattle-Tacoma and Anchorage, as well as subsequently among the latter (and other US destinations) is staggering to contemplate. Winter holidays and Ski Season certainly helped spread the virus throughout the US and into smaller localities.
The Chinese Diaspora
Perhaps more important than total routes and passenger volumes is the immigrant population. The US in general, and its west coast in particular, is home to a large Asian and Chinese immigrant population. Chinese New Year, and its festivities around January 25, 2020 spurred a great volume of travel and commingling of communities, not only throughout China but abroad in Chinese communities as well. This undoubtedly would have furthered the spread the virus throughout the West Coast and other parts of the USA.
Below are the centers of Asian populations in the US, according to the 2010 Census (new one is due shortly, 2020).
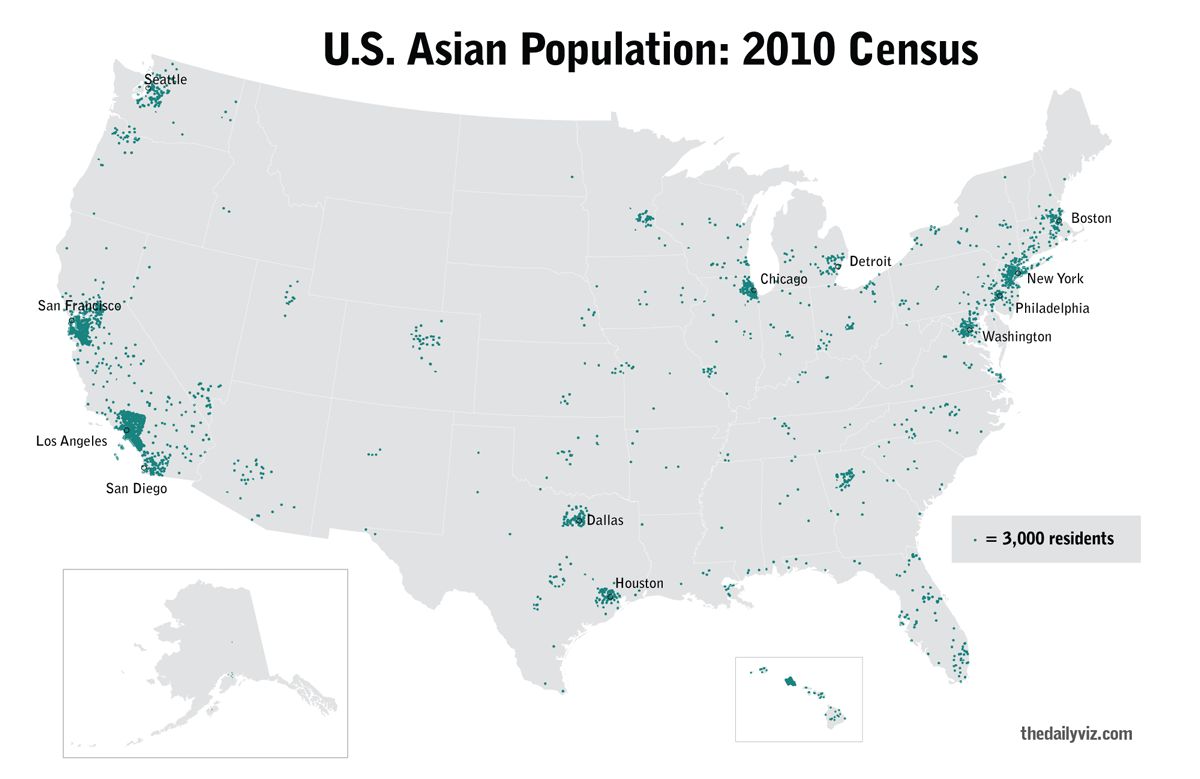
Clearly, we can see that the West Coast in particular, but along with nearly every major urban center in the US, is home to significant Asian immigrant populations. Below is a map, again based on the 2010 Census data, specific to the Chinese population alone.
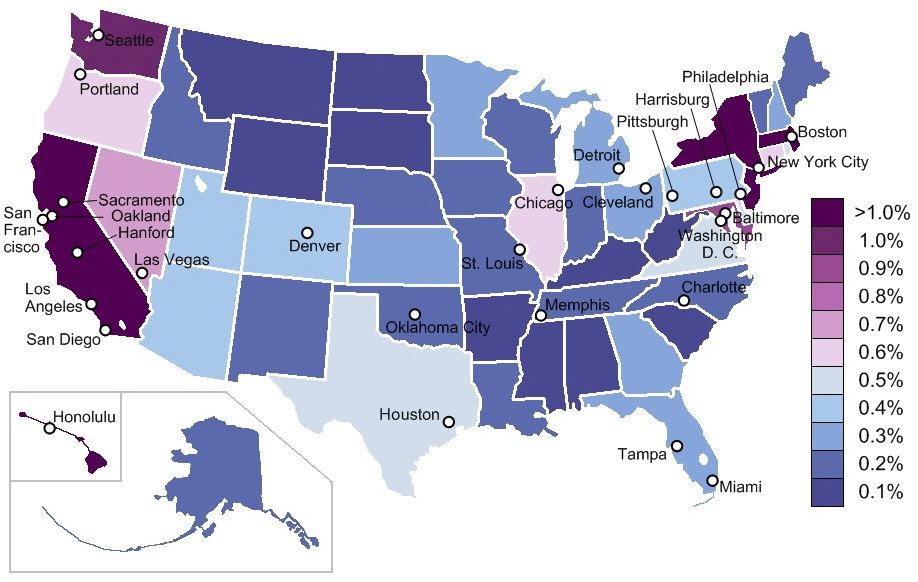
Here it is very clear that the West Coast is the epicenter of the Chinese American community. However, since the scale tops off at greater than 1%, and whole states are colored in uniform, it may seem that New York and its surroundings equal California in this regard. A closer look will tell a different story.
Below are the US cities with the highest percentages of Chinese residents. While New York city is not only on the list but is home to an impressive 486,463 Chinese residents, that is only 6.0% of the population. San Francisco on the other hand, tops the list with a 21.4% Chinese population, and 9 out of the top 20 cities, are in California! Two more of course are in the West Coast, Seattle, Washington and Portland, Oregon. Meanwhile, only two cities on the east coast make the list, New York City and Philadelphia (three if you want to count Pittsburgh). At 2.0% (and a lower 1.1% for Pittsburgh), Philadelphia makes the list with a relatively low percentage.
| Rank | City | State | Chinese-Americans | Percentage |
|---|---|---|---|---|
| 1 | San Francisco | California | 172,181 | 21.4 |
| 2 | Honolulu | Hawaii | 38,330 | 10.2 |
| 3 | Oakland | California | 34,083 | 8.7 |
| 4 | San Jose | California | 63,434 | 6.7 |
| 5 | New York City | New York | 486,463 | 6.0 |
| 6 | Plano | Texas | 13,592 | 5.2 |
| 7 | Sacramento | California | 20,307 | 4.4 |
| 8 | Seattle | Washington | 27,216 | 4.1 |
| 9 | Boston | Massachusetts | 24,910 | 4.0 |
| 10 | San Diego | California | 35,661 | 2.7 |
| 11 | Philadelphia | Pennsylvania | 30,069 | 2.0 |
| 12 | Stockton | California | 5,188 | 1.8 |
| 13 | Los Angeles | California | 66,782 | 1.8 |
| 14 | Portland | Oregon | 9,113 | 1.7 |
| 15 | Chicago | Illinois | 43,228 | 1.6 |
| 16 | Anaheim | California | 4,738 | 1.4 |
| 17 | Houston | Texas | 29,429 | 1.3 |
| 18 | Austin | Texas | 8,886 | 1.2 |
| 19 | Pittsburgh | Pennsylvania | 3,402 | 1.1 |
| 20 | Riverside | California | 2,985 | 1.0 |
Without a doubt, the West Coast houses the center of the Chinese population in the US, as well as the commercial and passenger air-travel hubs to China and Asia in general. As far as the Chinese diaspora in general, no Western country on earth, and in fact no country at all with the exception of Thailand and Malaysia, houses a greater number of the Chinese diaspora than the United States.
Why would the virus be ramping up last in the USA?
In fact, where did this fallacy come from anyway? The USA not surprisingly based due to all the data presented above, was among the first countries to detect and confirm a case. It actually did so surprisingly early, not as early as Thailand, which as mentioned above announced in or around January 13, 2020, but only a few short days after that. It may come as a surprise to many, it did so before Singapore and before South Korea.
Brookings, in an article published yesterday, gives us a very interesting diagram int with this information.
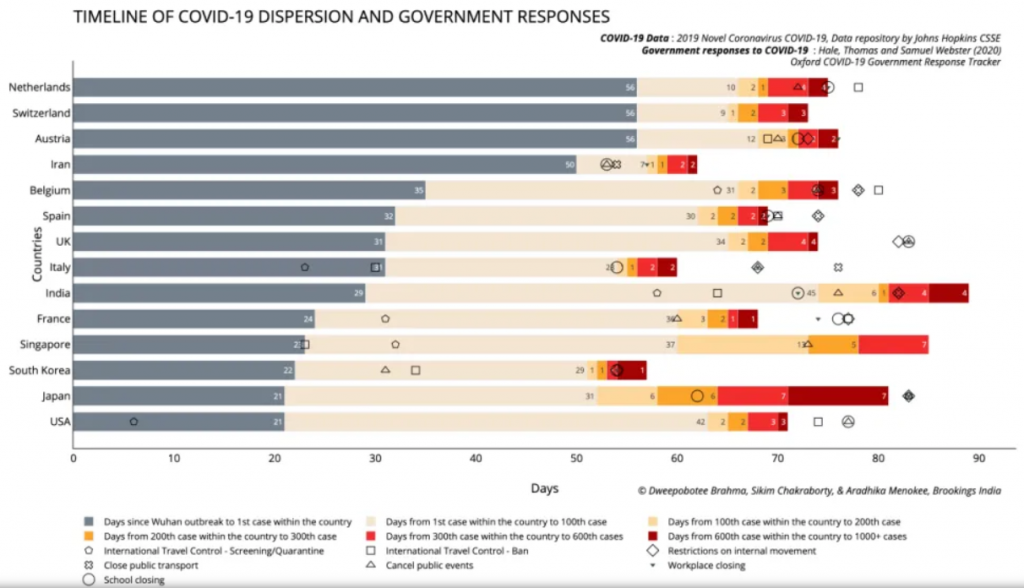
There you have it. While the US was first to acknowledge a first case, it confirmed its thousandth case after South Korea, France, Italy, Spain and Iran, all countries with a much smaller population. Relative to its population, it announced increasing cases (up to a 1000 cases, the data charted) very far behind all countries on the diagram with the exception of India. Proportionally, it even fell behind Japan, a country which has done it’s very best to intentionally not test many people (and thus also avert a media panic).
The point being that the US is not in the beginning of the curve relative to European countries, and I don’t believe New York is even ahead of California. As I have been writing for over 1 month (and saying for longer), this is a crisis which does not exist without the help of incompetent bureaucrats offering the tinder in misleading statistics and the media setting it all ablaze.
What arrived late to the US is not the virus, but testing. And as I have pointed out for just as long, there is a big difference between the real infection curve, and our testing numbers curve. There are two ways of handling this virus in regards to avoiding what the media will make appear as a devouring plague of mass death.
First, a country can simply not test at all. If you do not test for this weak virus, you don’t find it. People die in the usual numbers, due to the usual leading causes of death (now being called “underlying symptoms”), and many more get a mild case of the flu or the common cold, much as they are used to seeing on a yearly basis.
Secondly, you can take the approach that I have been recommending for also over a month. Test and test a lot! Test for the virus and test for antigens. If you test everyone, the “crisis” is over immediately. And this can be done for much less than the $6,600+ dollars per person the US 2 trillion dollar aid package translates to. If you test a large amount, you find a number of cases closer to the true number of cases among the population and this lowers the reported death rate. This lowers the panic, and puts the virus in perspective.
What you cannot do is test mediocrely and limitedly. This means basically testing people only in very serious condition, who are often hospitalized, and of course test every body postmortem for presence of the virus. This method ensures that you have the highest possible death count (a very incorrect and unreasonable way of determining cause of death), and the lowest possible denominator… the total number of cases. Especially with a disease which goes mostly unnoticed as asymptomatic or very mild.
Why the lowest possible numerator? Well a death rate is just that… a rate, and it is arrived at by dividing a numerator by a denominator. If you want to ensure a high death rate figure, have the highest possible numerator (deaths), and the lowest possible denominator (total cases).
Singapore, South Korea, Germany and Iceland for example have taken the second option to a greater or lesser degree, with the corresponding success. Mass testing.
Interestingly, Japan, which was well positioned for mass hysteria as it is well connected to its Chinese neighbor (note for example, the 7,000 seat capacity in direct flights from Wuhan to Tokyo in November and December respectively) and not only undoubtedly received the virus very early on, but also famously boasts some of the highest population densities on earth. The highly mobile Japanese public and economy would quickly spread this virus around. Japan has thus far simply ignored the virus, at least in terms of testing, and so no panic can ensue. Without this panic, you don’t have the overwhelmed medical system either, nor any abnormal number of deaths.
Other countries ignoring the virus in terms of testing (whether intentionally or simply due to a state controlled system which does not permit, or is at least not conducive to, private testing, while the state organs responsible for this testing are ill equipped to execute it in any significant numbers) are in Eastern Europe and much of the third world. Some of the people in these countries have better things to do then panic about this “strain of the flu”, they need to make sure that they and their family can eat today.
Another place where this virus has to be largely ignored is the armed forces. I write this particular section completely a priori, without any research whatsoever. I am sure there are notable exceptions and some may in fact have gotten media attention. But on the whole, a serious army cannot exist without pretty much ignoring it. Imagining my personal military experience here in Israel, I can understand for example, reserve duty being postponed for us now, but if “sadir” (the standing largely conscript army of 18 to 21 year olds), is anything like I remember it, there is no other way to handle this. At least in combat units, who are constantly packed together in training, bases, or on missions, one can imagine commanders explaining to the young soldiers that this virus (like so many other things) is dangerous for the older and less healthy civilian population at large, which they must protect at all costs, but nothing for young fit warriors to concern themselves with. Certain regulations can be instituted if anything for symbolic purposes, more hand-washing and the like, but these are largely possible only in down-time while on base. I can imagine little social distancing while on the field, in warships, tanks and a million other military situations.
At least in Israel I know our enemies won’t take a corona virus break (not that we needed the recent barrage of rockets from Gaza, meant to test our current resolve, to remind us of this), and so our IDF cannot either. In the case of the US, imagine whole fleets and aircraft carrier groups, on which the defense of much of the free world depends, packed with young men and not much possibility of “social distancing”. The army, thankfully, knows it plays a game far too serious for this tomfoolery.
And finally, in this update we can comment on the fact that very slowly.. all too slowly, some of the reporting is coming around to some of the realizations here discussed for weeks on end.
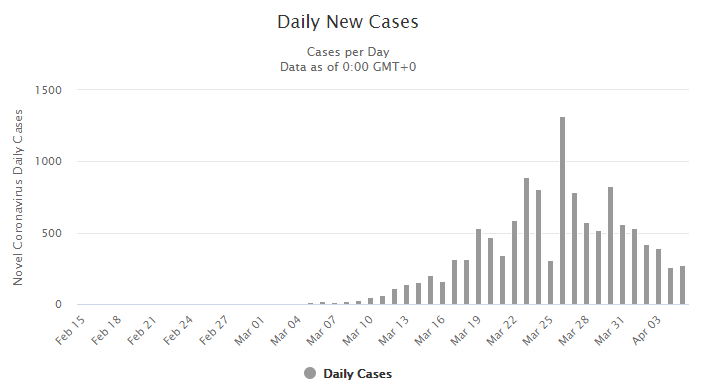
Earlier, we correctly predicted being passed the fake testing curve peak in Italy and a few other places (including New York), and that the coming days would see a drop in daily new cases.
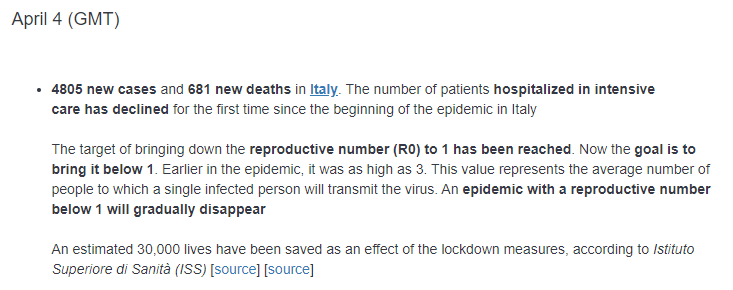
This largely still goes unnoticed of course because the media announces the ever growing total case number and total death toll number… which of course can never diminish, only increase. But as has been discussed, when daily case numbers are actually dropping despite sometimes exponential increase in testing, then it is clear that the real infection rate curve is in a very sharp decline. Today, we have from Italy:
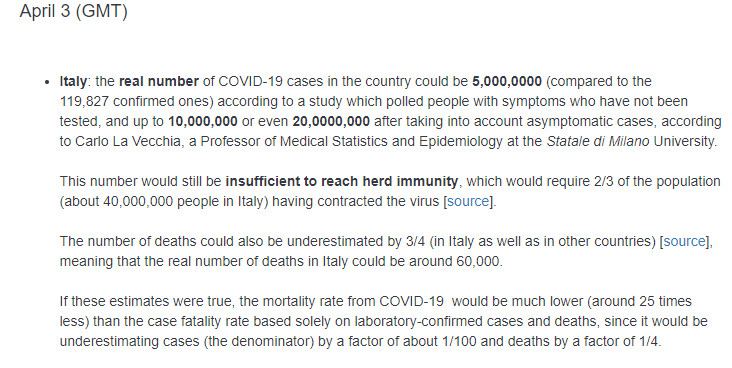
What do you know? Maybe Professor Carlo La Vecchia reads my blogs.
Meanwhile the madness continues, but logic is beginning to crack its outer shell and some light is starting to shine through.
April 5 Update
The Italian decrease continues:
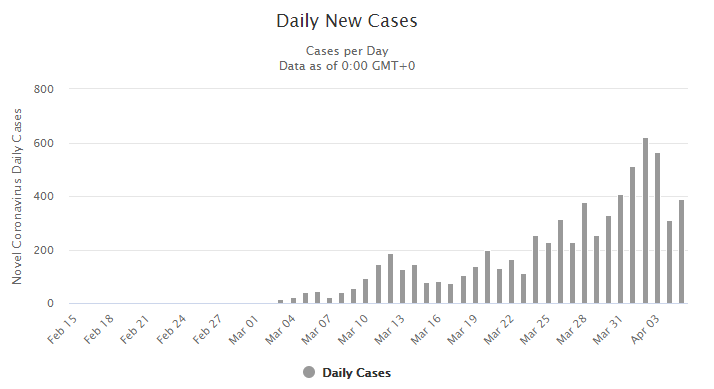
Spain clearly moving towards the end. Despite increased testing, lower new cases on a daily basis.
Same with Germany despite massive test numbers.
Austria:
Sweden, possibly starting to come down as well, despite having no lockdown of course (and enduring massive world pressure to lockdown along with everyone else, lest the western governments look like idiots).
The same in Switzerland and much (though not yet all) of Europe.
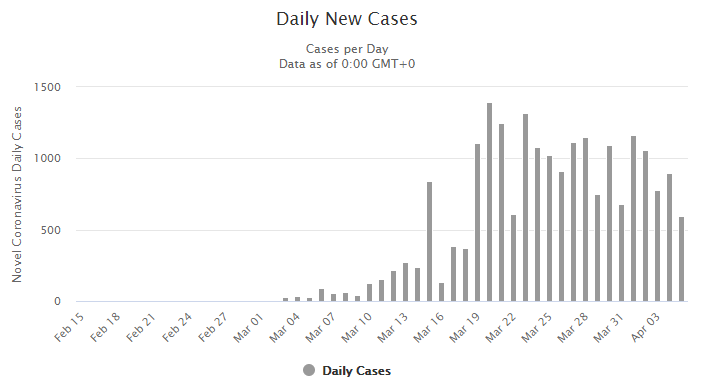
Of course the US, as was discussed thoroughly, would still be in a sharp increase in the number of new daily cases as testing numbers shoot up. And this is exactly what we have seen, along with the expected incorrect reporting that has triggered further fear, but at some point it will start to come down as well. Today’s graph includes a significantly smaller number of new cases for April 5th, but this should not be taken as accurate until tomorrow, it is still early in the USA. Up until the 4th, we have our expected increase.
But this does not mean that we are seeing the US at the beginning or even in the midst of that steep upwards curve, while the rest of Europe is near its end. To be repeated endlessly, there is the testing curve, and the real curve. Much of the April 3 update, and much of the previous updates and posts, are dedicated to this important concept.
As an aside, if it turns out that such a sharp downturn is already seen for April 5 (or another near day) once the final numbers are in, and it it is not related to a Sunday slow-down of test results or other malfunction, it would not be surprising and simply evidence of what has been here posited… that while the “testing curve” everyone sees is in sharp incline, the real infection curve can already be in sharp decline, and eventually that would become apparent.
Finally, for this brief update, a new set of data released by worldometers.info in table form will be wonderful to present here in chart form. This has to do with levels of testing, that is… tests performed per million people in a country’s population. Earlier, in various recent posts, this data was discussed partially, with examples from various sources. However, a large list of testing numbers for many countries was not available for matching dates. Perhaps inspired by the analysis presented in these series of articles, worldometer has come through in providing this missing data in summary form. Assuming that worldometers’ data is correct, or at least in the ballpark, a much more direct form of supporting evidence can be presented. That is to say, earlier, in an attempt to simulate the number of tests per country, I (cleverly if I may say so myself) presented the number of cases per million people in a country vs the crude death rate. It was ironic at first glance to see, that the more cases of covid19 a country had, the lower the death rate it was reporting.
The explanation of course, was that the lower death rate stemmed from simply knowing about more of the cases out there, and thus having a higher denominator. Countries that tested no one but dying people in the hospital, were reporting very high death rates.
With this data in hand, we can apply the testing number directly to this theory, rather than the confirmed case number. Will we have lower death rates with higher testing numbers per capita?
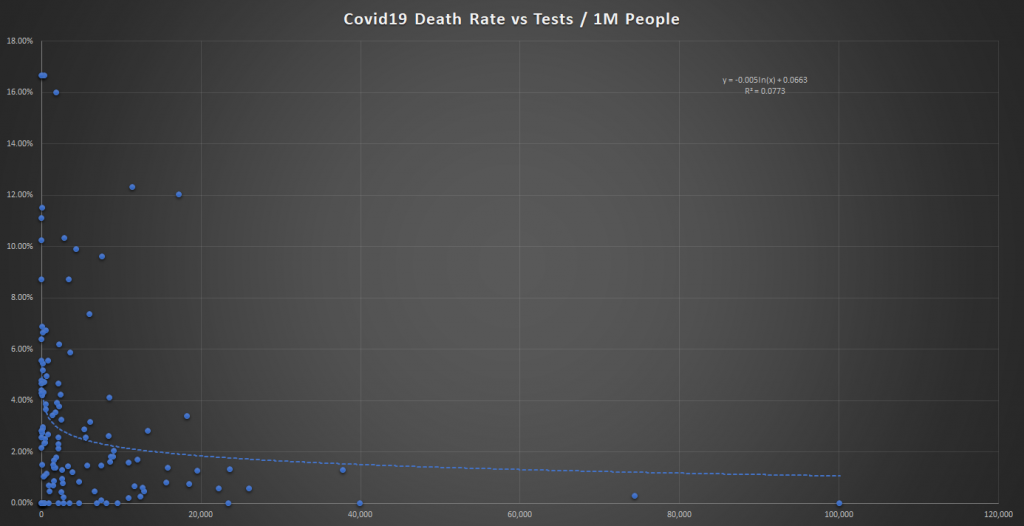
Of course we do!
All countries performing more than 20,000 tests per million people have a death rate of under 2% for the covid19 virus. It goes down significantly from there towards zero as the intensity of testing goes up.
In the countries testing less than 20 thousand people per million, especially those with much less than that, anything goes. Death rates can be anywhere from zero to over 16%! Still, our Y-Axis has shrunk from that in our original update, when the top country (Ukraine) was reporting a death rate of 33%!
See earlier graphs in this article.
So once again, crude death rates for most countries, which have performed little testing per capita, are fairly meaningless. In some rare cases where the infection did not take hold at all, they may be correct (and near zero). In other’s it has little meaning whether high or low. Even testing 40 thousand people per million is far from catching all cases, especially since most are asymptomatic or mild. And even then, people can test negative not only with false negatives but also for those who have already surpassed the virus (and would be detected only with a serology test). In all cases, the denominator ought to be so much larger!
Iceland, which according to worldometer has tested over 74,000 people per million has tested a significant number of its population (7.4% of its total population!). Iceland has reported only 4 deaths (.26% death rate) from COVID19 (and is the last place you’d imagine based on media coverage to have a high infection rate.
Except, at 4,479 cases per million people, it is the 5th most infected country on earth based on reported numbers! And even that is behind only very small countries (Vatican city, San Marino, Andorra and Luxembourg) that either have also done a very large amount of testing or simply detected a large amount of cases per capita.
Now San Marino is clearly in the mouth of the volcano and if it tested as much as Iceland (it would find many more cases), and the same goes for Luxembourg who has tested about half as much as Iceland (still relatively very impressive).
In any event, Iceland’s official infection rate towers over the rest of the world’s. Some 5 times that of the US, and more than double that of Italy’s! The point being that in reality Iceland belongs near the bottom of the rankings of infection rates, and yet it is at the top… due to the lack of testing in most countries and misleading figures the public is given.
And Iceland still only tested a bit over 7% of its population according to this data, and if it tests just another 7% or so, for a mere total of 14% it would surely tower over every other country in the rankings for the most covid19 infected country on earth (and it’s death rate would drop another 50% to .13%). Does no one see this?
I am starting to think this is the twilight zone.
A final important piece of data that has come out of Iceland is that about 50% of its cases were asymptomatic. A significant additional chunk were cases with mild symptoms. We already knew that from our very first article focusing on the Diamond Princess. Because at least half are asymptomatic and another 20 to 30 percent very mild, most countries are missing the vast majority of the cases.
And these people continue the contagion in the daily ritual trips to the supermarkets (since there is nothing else to do) where we all handle and touch products right up to the cashier stations (don’t worry some cashiers only spread the virus with gloves, not their own hands!), as well as in trains, subways and buses. The rest is taken care of by hospitals and other medical facilities and the vast number of people in “essential services”, which include the many cooks, kitchen staff and delivery people that bring us takeout every day. To say nothing of the many others involved in the production and transportation of all our goods throughout our countries. Importantly, we always stay indoors where virus spread the best (see the Japanese study referred to earlier). Some kind of lock-down, the only thing it achieves is the devastation of economies and lives, as long as it does that all is good apparently. Logic, reason and a cool head have no place in today’s world.
Signing off with a final point to stress. Besides the faulty statistics which I stated fuel this panic from the very beginning, there is an actually important issue at hand. Rather than the absurd lockdown, which stops some spread of the virus but far from all of it, medical facilities have a critical job to do in this matter, and to date it is being done to varying degrees in various countries. In some places, it is disastrous.
People in the poorest of health, often older people, frequent medical facilities and of course are sometimes hospitalized. Suffering from whatever ails them, they many times are on the brink, and a good medical environment can help them pull through. If what they get instead, is a hospital filled with covid19 not to mention every other virus and infectious bacteria known to man (including the infamous “super-bugs” that inhabit hospitals and are resistant to many if not most known antibiotics), that can mean the difference between life and death. In the current environment, it gets chalked up to covid19 no matter what, but that hardly matters. Hospitals should have been the first, rather than last, places to institute the strictest of sterilization and isolation measures.
ICU’s are notorious for places where people at their very weakest contract all sorts of nasty infections, and many studies have pointed that out long before this covid19 fiasco. At the very least, these type of covid19-rich environments create a positive feedback mechanism. When many of the ill catch the virus, there are high counts of dead with the virus, and regardless of whether it is reasonable or not to attribute the death to the virus, this increases the panic. This brings in more people, everyone who sneezed or has a sore throat, etc who normally would stay at home now comes running to the hospital in frantic fear. The concentration of virus increases and so does this phenomenon in general, including the over-strained and overcrowded systems.
At worse case, the high infection rate of the ill and elderly patients does contribute to deaths which otherwise would not have occurred. It is imperative for the medical professionals, who ought to understand what is and isn’t dangerous in this mania, to apply and push for every measure to be taken to isolate covid19 patients (and other infectious patients) from the otherwise ill and/or elderly patients. It is clear that a combination of this failure (much larger in some places than others), and the faulty statistics, which include false number of true cases and false or exaggerated cause of death attributions, are the main factors in the occurrence or reporting of high death rates.
An early focus on either of those obvious issues, would have saved everyone a world of trouble, not to mention lives. Sadly, I am yet to see an acknowledgement of them widely reported. Share this article, that will help.
April 8 Update
Full explanation coming after Erev Pesach! Enjoy the graphs meanwhile.
Recall I used the weekly statistics from the UK earlier, in anticipation of this phenomena in the US and elsewhere as well, but the CDC data had not been released yet. Now it has at least until week 12 and 13 of the year.
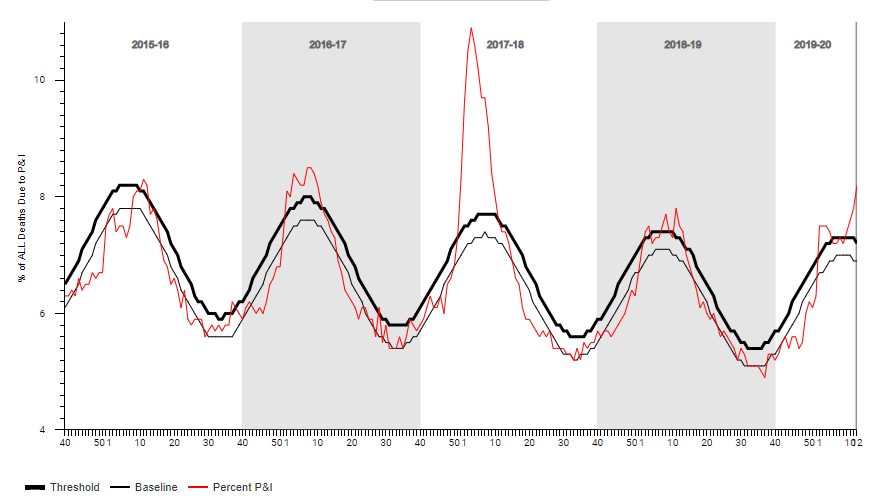
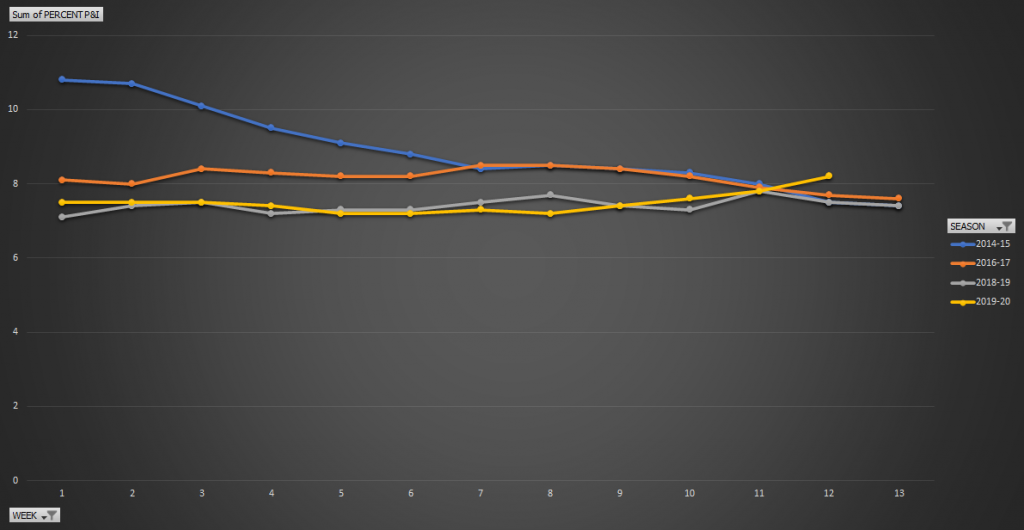
From the CDC. Percent of all deaths from Pneumonia and Influenza 2015-16 seasons through 2019-20 season (thus far). Keep in mind that data for recent weeks from the CDC may not be complete.
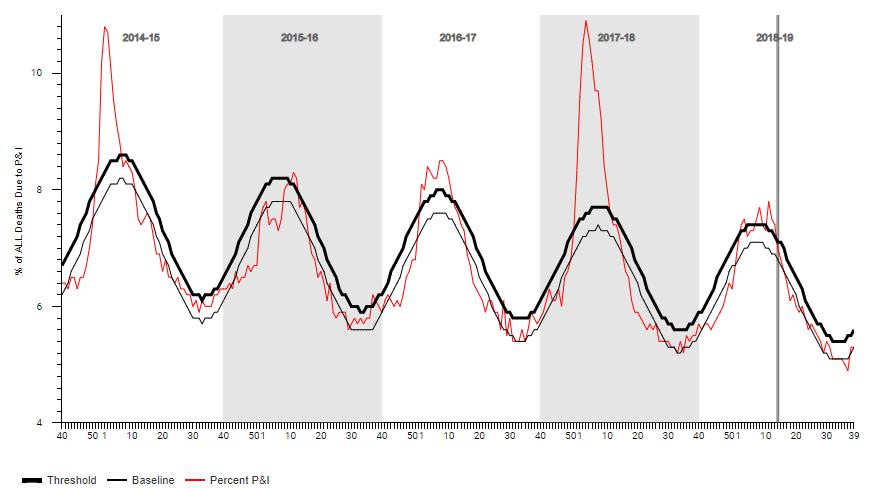
Same a further year back:
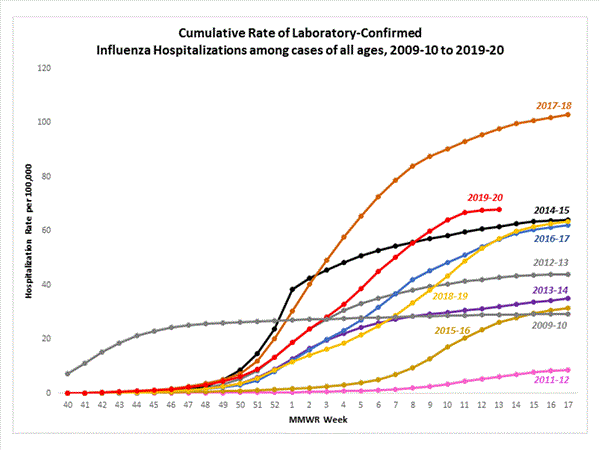
Lab confirmed Influenza hospitalizations.
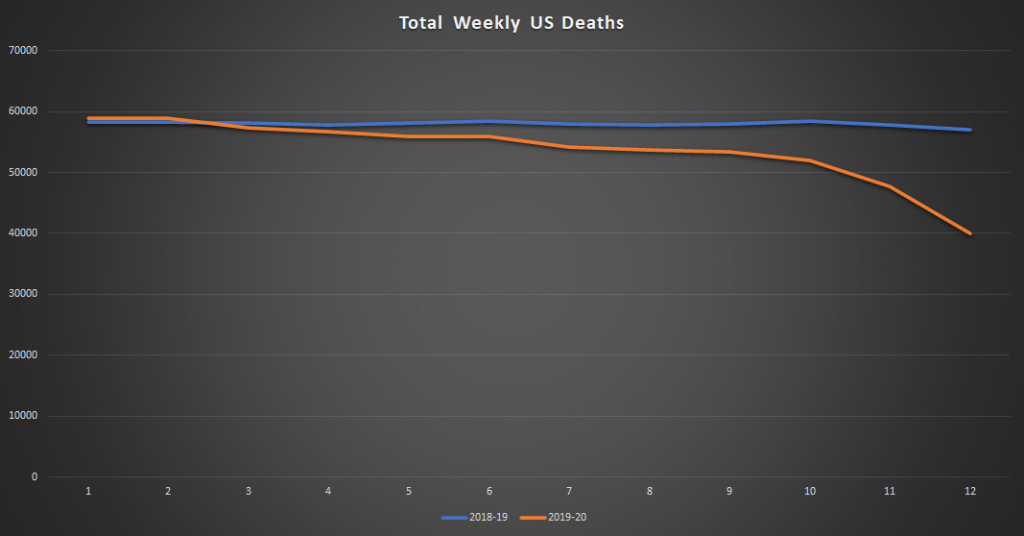
Total weekly deaths as reported by the CDC thus far.
Then the data they want you to note, percent of deaths Pneumonia and Influenza. Note it has been lower than all the harsh seasons recently, but inching upwards. The CDC only charted (as seen above, this percent data and not total number data).
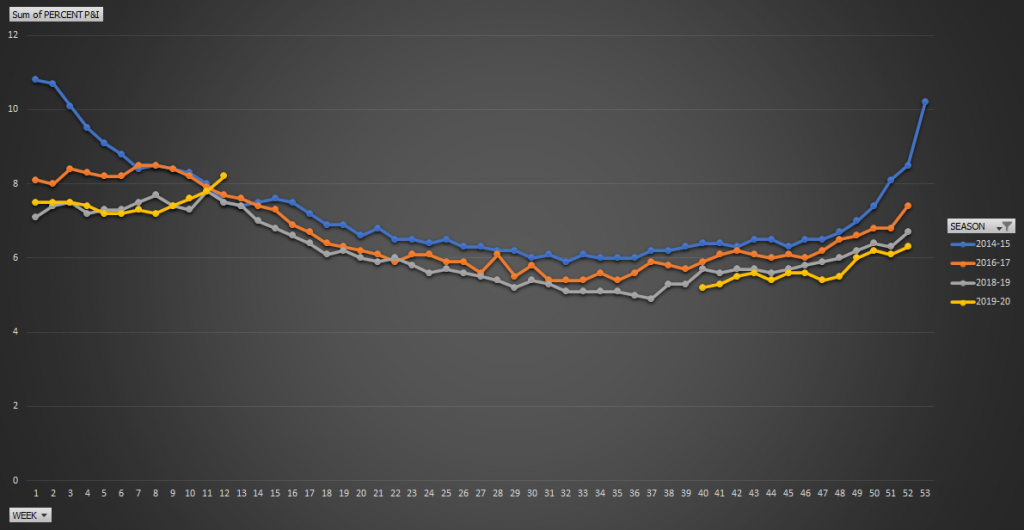
And the same but for all weeks in the year (for 2020 only up to 13 available of course).
But note total deaths, despite increasing population and an aging population, rather than a percent of all deaths.
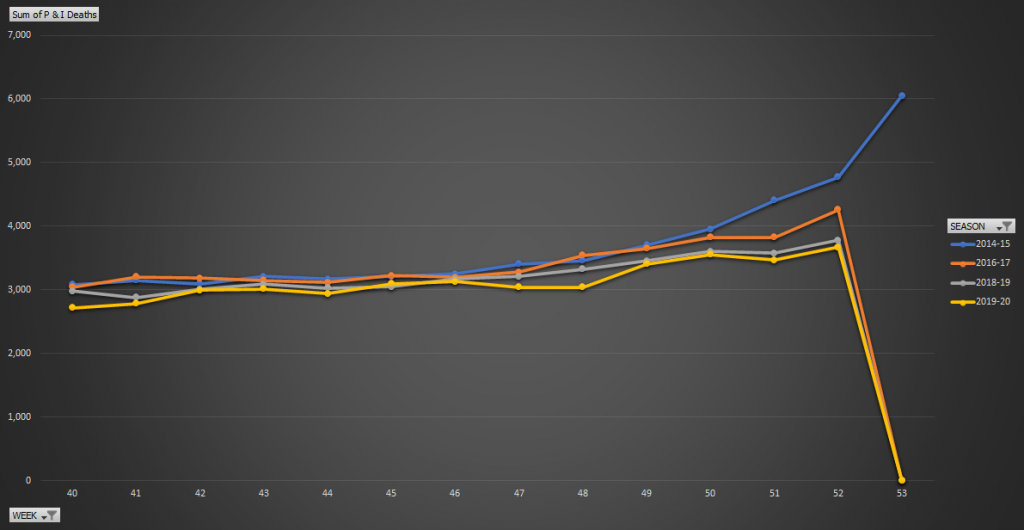
Total Pneumonia and Influenza US deaths.
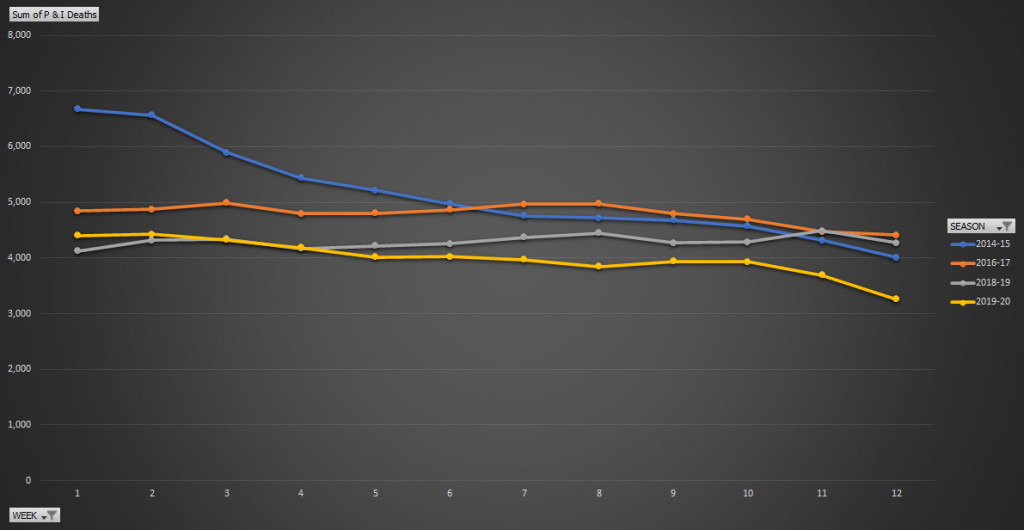
And for the latter part of the year (begging of the flu season):
Interesting no? I think so.
Elaboration coming shortly!
Your most recent graphs are hard to interpret at what time of year they represent. For example your last graph shows weeks ending at 53 for 2019-2020 graph. Does that mean week 53 of 2019, if you could clarify this I would much appreciate it.
Thanks for thoughts and assembling the data for presentation.