


Notes: Includes “EndGame” Section. And additional Update Sections.
For a background on the 2020 outbreak, feel free to refer to my first article on the topic, The Truth and some Perspective on Coronavirus and the 2020 Hysteria, written very early in the western media experience of this outbreak, and for a much longer and more detailed look at the virus’ death rates and the hysteria and panic surrounding it, my update, Covid-19 Update. The weakest virus known to man is highly recommended.
Now, with some more days of significant data available, I would simply like to provide an update on some of this, without much background, as it is provided in the previous articles, and some additional data supporting some of my other assertions which was not available at the time. The data is quite interesting, still not surprising, and in stark contrast to almost everything being reported.
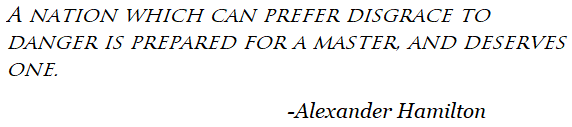
First, let us look at perhaps the most important graphs I provided in my previous update. they were done with data approximately dated March 15th and March 18th. For March 15 data, the following overview was presented:
The idea being, that much unlike what you were being told, the MORE cases a country was reporting relative to their population, meaning a higher infection rate, the LOWER the death rate being reported, and vice versa. Watching the media one would be sure that as these cases per million went up, the exponential curve depicting the mass genocide would clearly be evident.
Now, this does not mean that the more cases a country actually has (relative to its population), the lower its death rate will be. It was simply showing that the higher number of cases a country ADMITS they have (ie better testing), the lower the death rate appears to be. The true death rate of course is even lower, because all countries missed many, if not most, and if not an overwhelmingly most, of their cases. The countries with better testing (less socialist restrictions on testing) simply missed less of them.
In the US for example, the CDC completely restricted testing for months, with a bureaucratic ineptitude that could rival if not beat the most socialist of European states, and it remains problematic and difficult even at the time of writing .
The graph clearly shows certain anomalies such as Spain, Iran and the Ukraine. Spain and Iran, were clearly under-reporting total cases more than other countries, and Ukraine showed us the absurd extreme of this phenomena, it reported 3 cases, and 1 of the individuals unfortunately died; a 33% death rate.
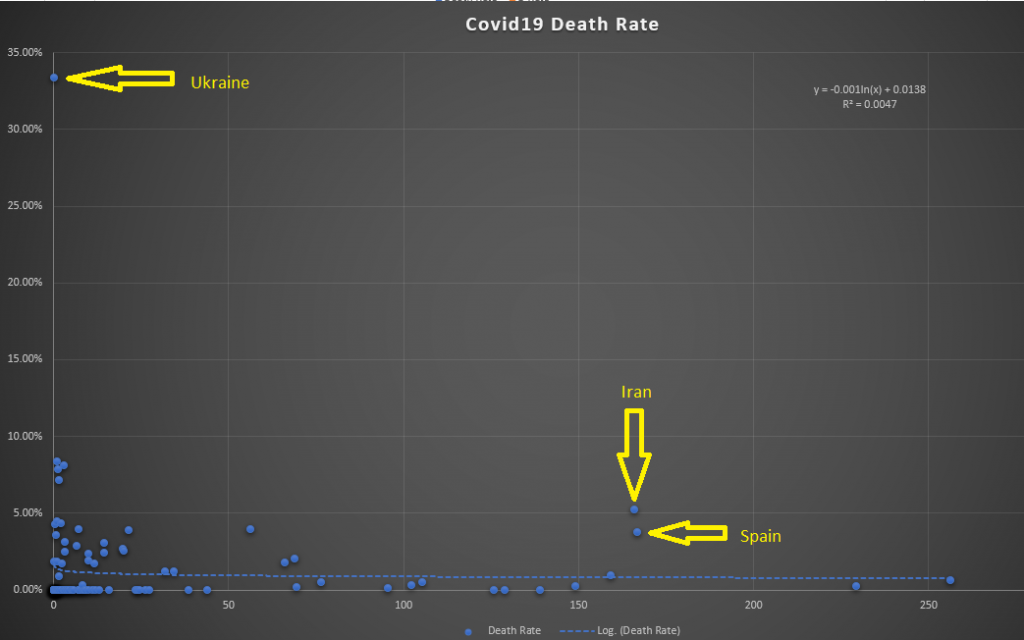
The former piece went on to show other data including this March 18th data “zoomed in” graph:
Iran and Spain are clearly seen (at either side of the 200 cases per million line on the X-Axis), as belonging further left with the other counties which are massively under-reporting cases. Italy was removed from this chart but would be in a similar case if plotted. The trend for the death-rate is clearly downwards as cases per 1 million population increase in a country.
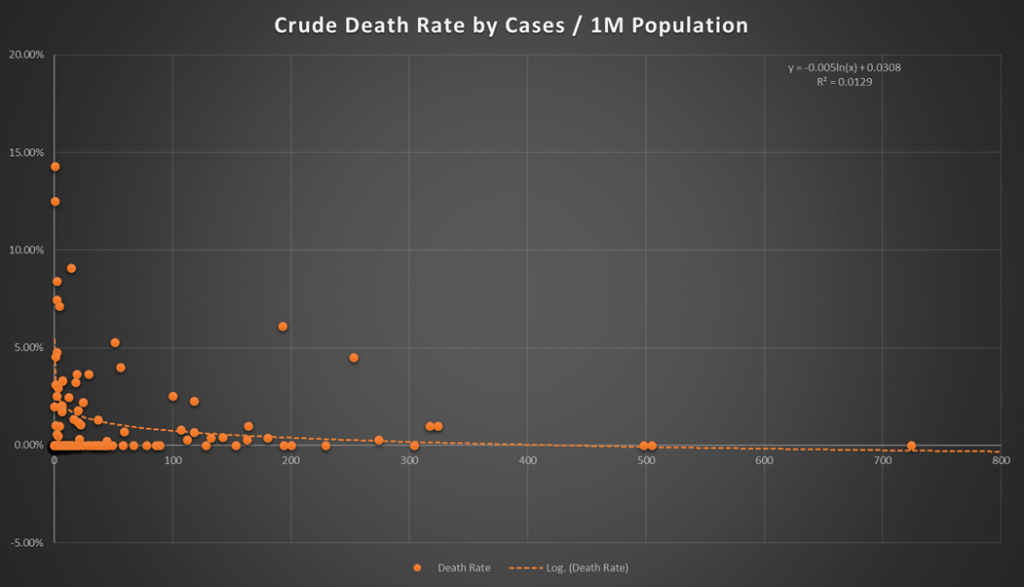
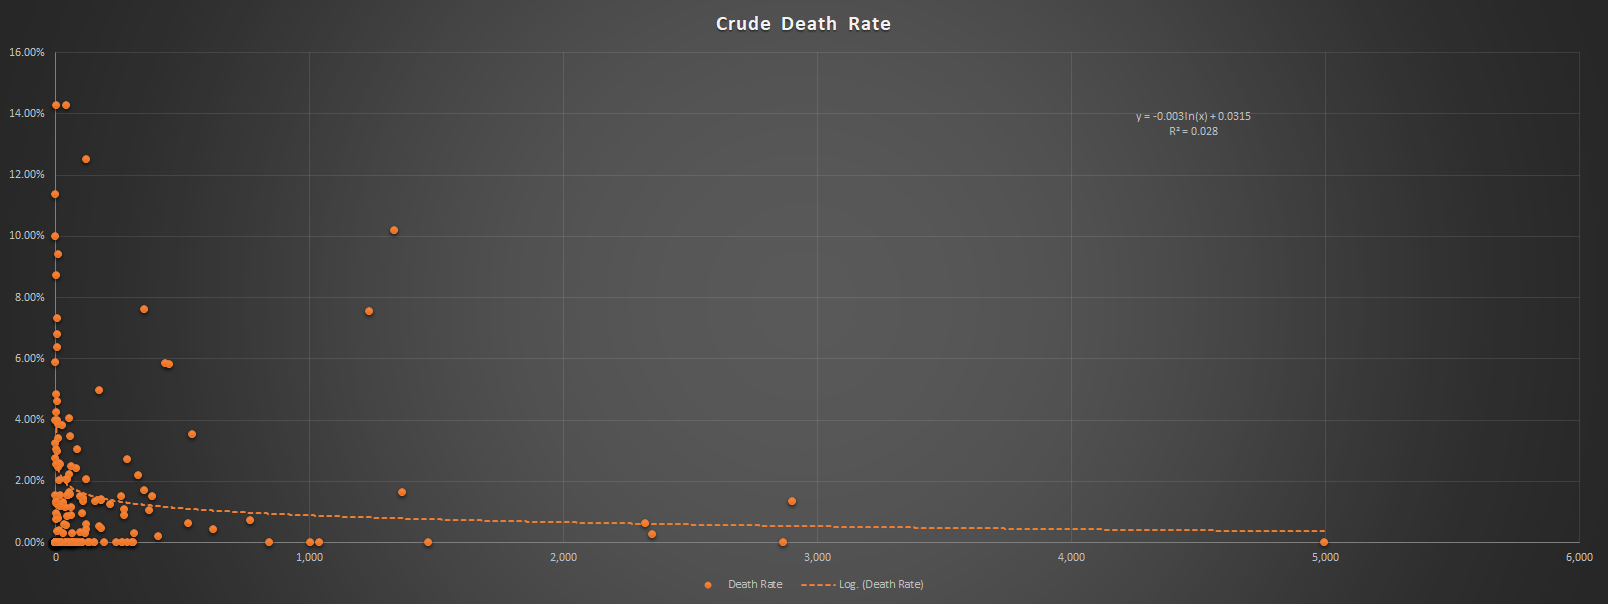
Let us look at this same chart, updated with March 26th data.
The trend becomes all the more clearer, it seems to be logarithmic, and even including all countries (only San Marino was removed from this data set), the R squared fit is much higher at .028 than with the previous data also unsurprisingly. The numbers in general have also gotten much higher across the board as far as cases per million.
The previous update correctly predicted that Spain was heading down a similar reporting path to Italy, as has now been seen. However, you can clearly see how these two outliers clearly simply belong “leftwards” on the curve. What is happening is that though they are reporting a significant number of cases per million, not much more than many other countries which anecdotally seem to have a much lower true infection rates. They are also not reporting even close to the highest infection rates among the countries. Several countries are reporting about the same or many more cases per 1 million people, in fact several times more, while having very low crude death rates. The line as you can see trends to well below a 1% death rate.
We have discussed how that crude rate is misleading for any individual, as the death rate for most relatively young and relatively healthy people is statistically near 0 and is quite a bit higher for older, and less healthy people, much like any other number of viral and bacterial infections. For more on that, please refer to my previous articles.
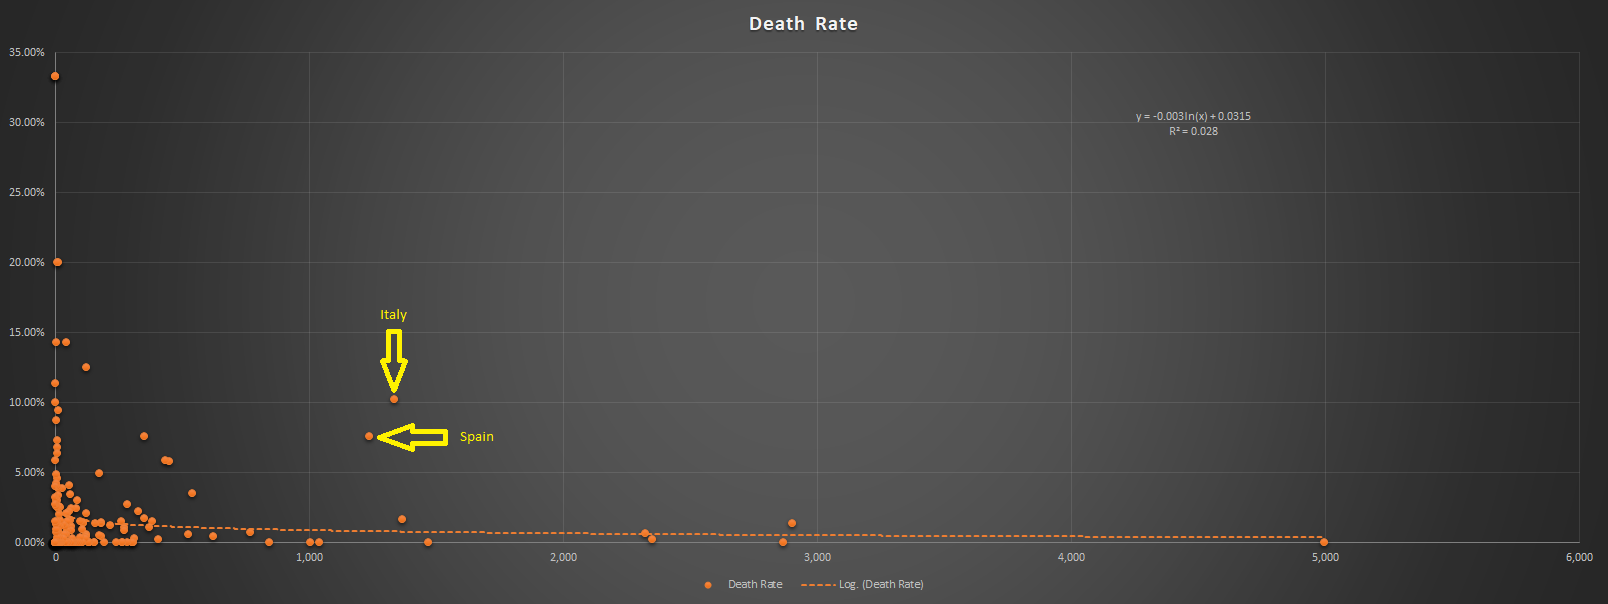
A more “zoomed in” version of the chart, with the Y-Axis only going to 16% death rate, leaving those countries reporting above that off the chart. The trend is even more visible and the fact that that Italy and Spain are drastically under-reporting overall cases and probably also over-reporting deaths (with Covid19 as the cause) can be seen.
Let’s take a closer look at these data-points, each which represent a country’s reported data.
We keep hearing endless talk about the “curve”. The truth is that there is a real curve, and our fake numbers, or “testing curve” if you’d like to be more generous. The virus has gone around the world and infected who it has infected, we do not know what the reality is there. And then we have the fact that as our tests rapidly rise from basically 0 as they were a short while ago, we keep finding more cases.
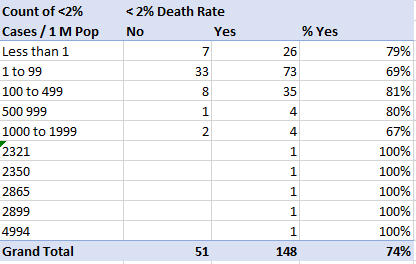
The above is a breakup of the datapoints, or countries. So row one tells you that of the countries that reported less than 1 covid19 case per million people, seven of them are not reporting a crude death rate of under 2%, while 26 of them are. In other words, seven them of ARE reporting a death rate higher than 2%.
We clearly see that the percent of countries reporting a death rate under 2% increases as they report more cases per million. After the category of 1000 to 1999 cases per million, individual cases are shown. There are 5 countries, whose numbers range from 2321 cases per million to just under 5000 cases per million, all of which are reporting a crude death rate of under 2%.
We organize the same data in a similar table, but now for countries reporting a crude death rate of less than 1%, rather than 2%. We have:
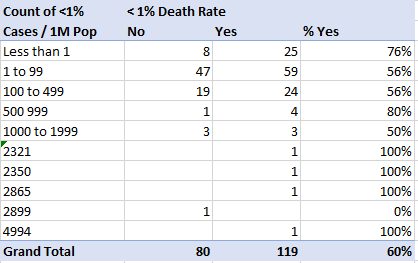
We see a similar result.
Basically, many countries are reporting a crude death rate of under 1%, 119 of them, compared to 80, which are reporting one higher than that. However, those eighty are concentrated in countries with low cases per million people, rather than with a high number of cases per million people. And this clearly shows low testing rates, and faulty statistics.
For a death rate under 2%, it is 148 countries “Yes,” and 51 “No”, again the latter completely concentrated in low reported infection rate countries.
A Word on Testing
What this indicates to us is that we are playing a game entirely in our heads, a game of hysteria. Tests were completely unavailable in most countries until recently and remain highly restrictive in most places including the US. So of course, as the testing ramped up, more and more cases were found. Let’s look at some of that data.
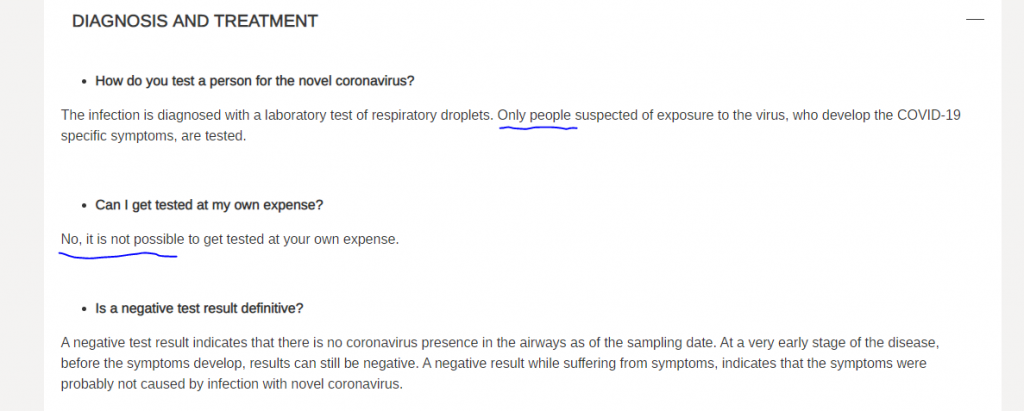
Let’s take Israel as an example. So can an individual, in this 1st world high tech country, which as explained in my previous update, actually and shockingly ranks among the most free market of the socialist European area systems, get tested because you want to? Of course not. From the Ministry of Health webpage:
In Israel for example, previous to early March, testing was minuscule. It slowly increased as the month progressed. The government announced on March 12th its plans to increase testing from 600 a day to 1,600. On March 23, they announced they had performed 3,208 in the last 24 hours. From that day until the 26th, you have about 3,000 tests daily.
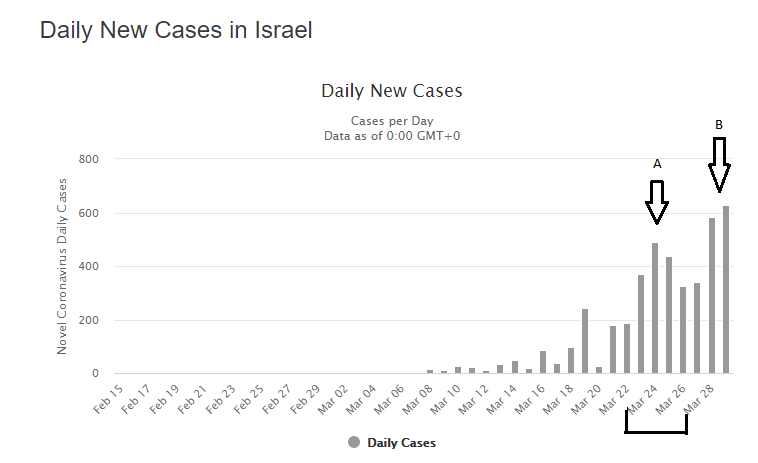
Not surprisingly, the daily cases “found”, under area “A” in the chart, on those days immediately jumped. Roughly to 13 or 14 percent of the numbers tested, that is about 400 cases found each day, for every 3,000 tests also performed each day. In Israel, test results come in much faster, sometimes after a few hours, then in the US. In the US, testing is in the hands of the CDC and state labs, which are untested in critical market situations. Israel has much more experience in socialism. Subsequently we a drop for two days in cases, which was widely reported on due to human error in the data entry system of the ministry. Many test results were held up, and likely show up later.
Today, testing is reported at 5,000 (though earlier the goal had been announced to be already at 10,000) tests a day, with the government announcing that it wishes to double the previous goal to that of 20,000 a day shortly. Not surprisingly again, during the last two days, under area “B” in the chart, we see another jump as the number of tests go up, to about 600 cases a day, which also not surprisingly, is about 12% of the new daily test capacity!
Though this may make you feel like you are crazy, we are no more “detecting” new cases in the country than we are discovering new intelligent life on earth when we test people’s IQ!
Somehow, in the latter situation, we all know that the person already existed with a certain Intelligence Quotient, and we are simply going to find out what it is.
These daily case reported results are not necessarily matching, in neither magnitude nor even in trend, to the real number of cases in the country. So while the cases are clearly increasing in the reported statistics, because more people are being tested, the real number of active cases could in fact be decreasing, or increasing at a much different rate, or doing just about anything else.
After looking at several countries’ reported data, we could paint the same picture over and over. But let’s jump to a big country with testing data publicly available for quite a long period, the USA!
So first let’s look at the relationship of the number of tests on a given day and the confirmed cases announced that day.
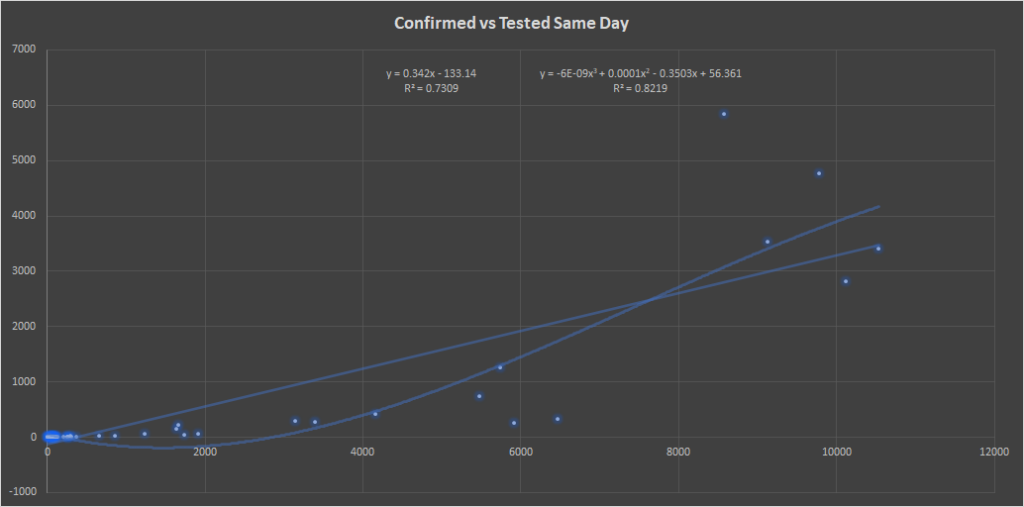
We definitely see a very strong test, the more the US tests, the more cases it finds. A linear trend has an R squared of .73, and a third degree polynomial trendline, with better fit at .8219 (1 is a perfect fit). But we can do better. We know that results take days in the USA, and the CDC website itself lists a number of caveats and limitations regarding that issue alone among several others. The CDC has previously indicated a 4 day lag, for numbers to be reasonably accurate, and now has revised it to 7 days. Due to this, we will only look at numbers up to March 20th.
If we now plot the number of confirmed cases reported each day, with the number of tests conducted 4 days prior, we get the following:
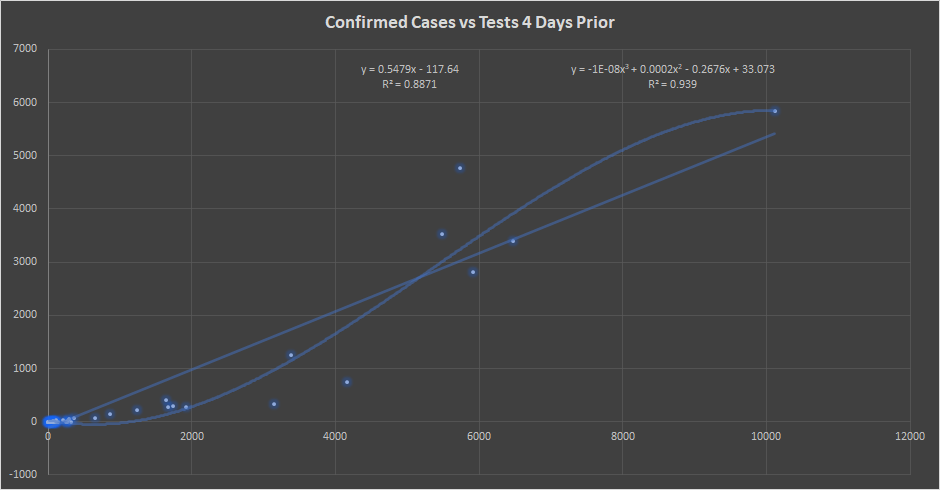
An incredible fit! A simple linear trendline has an R square of .8871 and the same third degree polynomial one of .939! It is nearly a perfect fit!
What this shows is that much more of the increasing cases can be attributed to the increasing test numbers, rather to a changing actual number of infections in the country. Of course that during this time, the actual infection rate was changing, and this may be why the relationship is closer in the polynomial than in the linear, but in either case the fit is quite high.
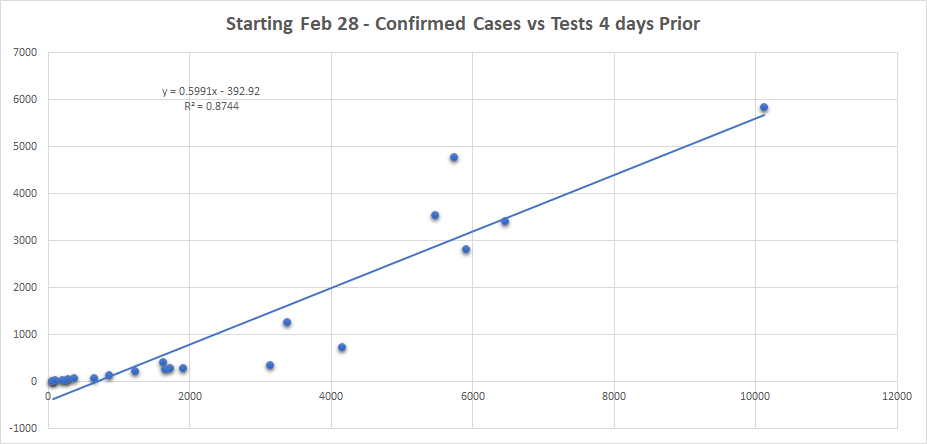
The polynomial is bulky and likely “over-fit”, and if we remove the days when the US had 0 confirmed cases we get a very good fit for a weak power function. We remove the 0 days because this allows for testing other types of trends, such as exponential and power functions, and because they are days with such small numbers that they are likely to simply cause “noise” rather than add value.
In fact, what we see with these non-zero numbers, which basically mean the same data starting on Feb 28 2020, the fit gets even better!
For a linear trend, the R squared jumps to .8744!
and when try a power function, we get a near perfect fit with an R square of .9456 (nearly perfect!):
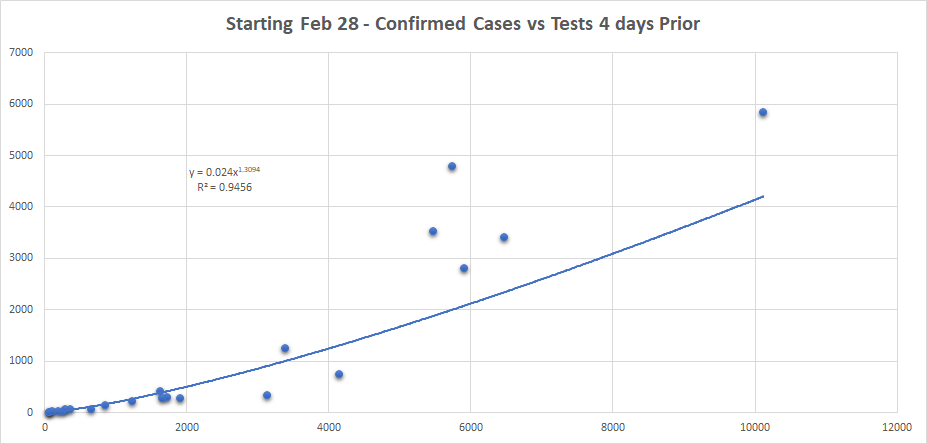
The weak power function indicates that the true virus infection rate was probably, but not certainly increasing during this time or some of this time. However, while this weak power function is a near perfect fit for the data early on, it misses more wildly on the the latter data (when the US was testing much more), and the linear fit is actually better on these more recent data points. I won’t speculate further about that at this point, because this article is meant only as a quicker update, and would like it published sooner rather rather than later, but that is certainly quite interesting and worth a look. It may also be the case that earlier test results had a higher false negative percent since many nurses and medical staff did not yet know how to get the appropriate swab (there has been some anecdotal evidence pointing to that fact as the swab is apparently quite aggressive and deep).
In any event, it is abundantly clear, that the more tests, the more cases we find, and that is what is happening, completely detached from the real number of cases out there. I predicted this in my very first article, stating that we were in a fake containment, fueling the panic, and waging a war against our fake numbers.
Now that we have seen that beautiful relationship between tests and confirmed cases, let’s see the big picture. If we line them up on matching dates, meaning the number of total confirmed cases announced by a certain date, with the total number of tests on that same date, we get the following:
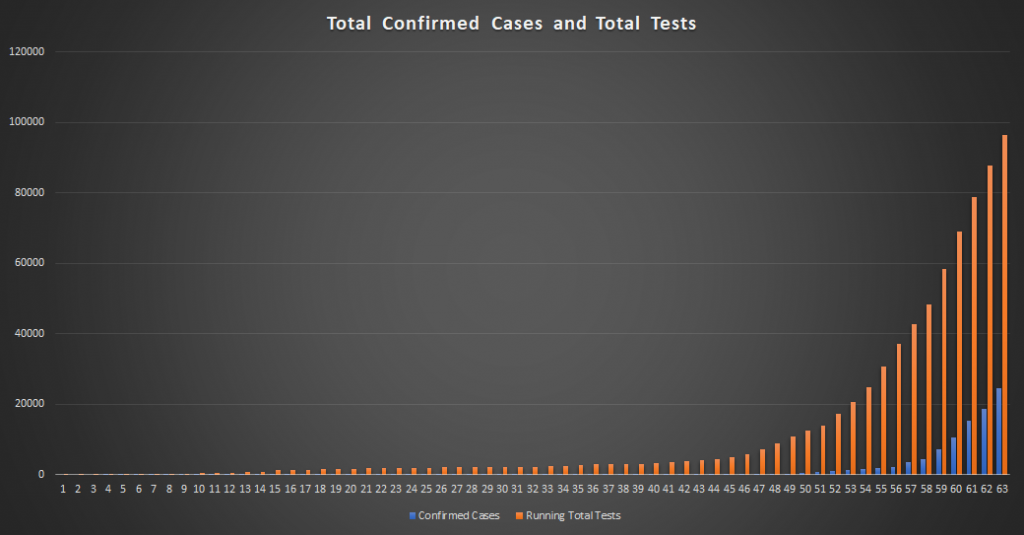
Yes that matches very nicely, we see more confirmed cases (the blue), as the total number of tests increase for the USA, but it seems like the tests are outstripping the cases a bit.
Since we have seen that there is a much better fit when we take test numbers from 4 days previous (so that they better match the confirmed cases), we get the following:
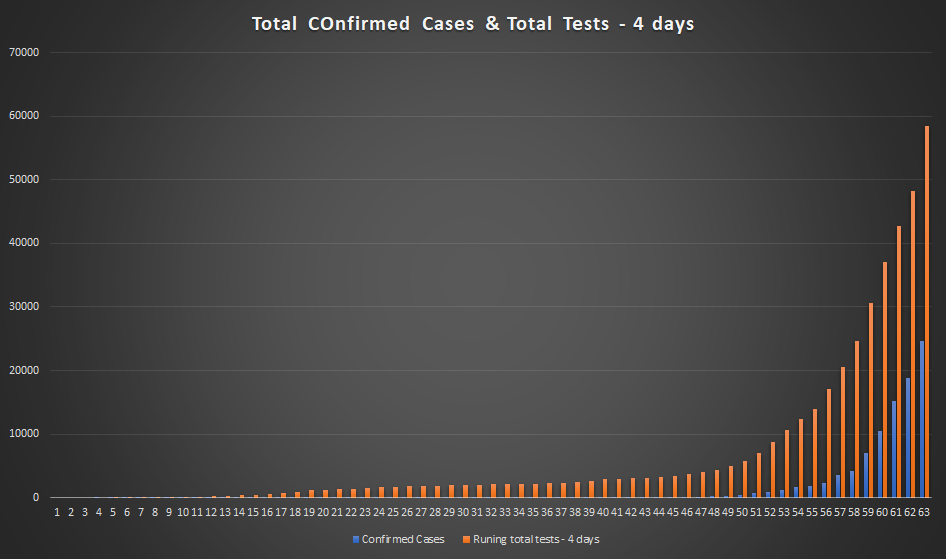
Amazing, you could not make up better data if you tried. So the CDC and the news is showing you this:
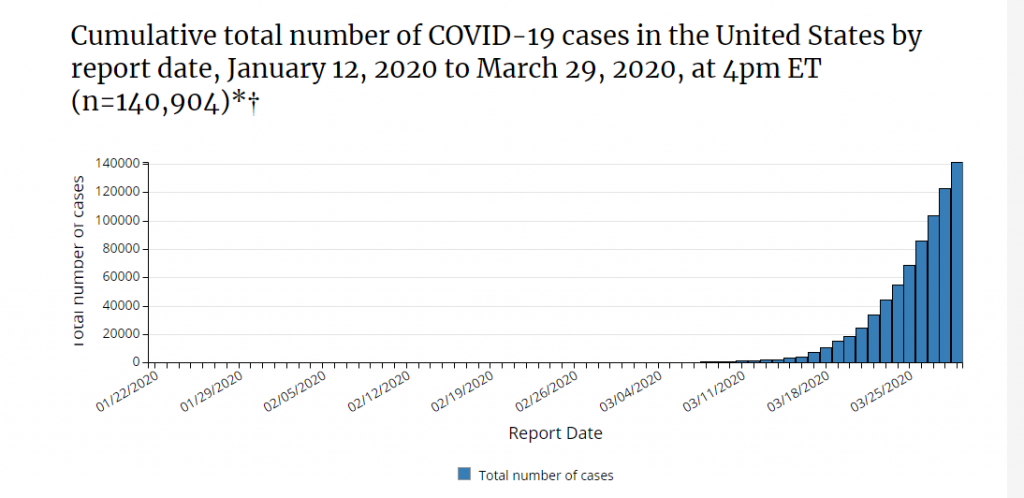
Which looks like a very steep, and not to-end-anytime-soon, curve, without any context of the fact it is directly related to the number of cases tested.
And this is why we can have the following situations, as was mentioned in my previous updates.
- Tom Hanks and his wife tested positive for Covid-19 in while in Australia on March 12th when Australia had reported 127 cases! Out of a population of 25 million people (plus tourists such as Mr. Hanks), that is 0.000508% of the population, 127 cases but two happen to be Tom Hanks and his wife.
- On March 25th, Prince Charles announced he had tested positive (though he had mild symptoms for days of course), in the UK, which was reporting 8,077 confirmed cases out of a population of 66.44 million. That is .012% of the population but of course, it includes Prince Charles.
- Prime Minister Boris Johnson soon followed suit only two days later for good measure of course.
- In the USA, Senator Rand Paul (who I very much hope happened to have stayed away from his father lately who besides being a champion of liberty and a very nice man, is now about 84 years old, may he be well), announced he had tested positive for COVID-19 on March 22, when the US was reporting 26,892 confirmed cases. With a population of 327.2 million, the confirmed infection rate was .008% but of course by then several congressmen were infected as was at least one senator, NBA players and quite a few famous actors, celebrities and well known government officials at the state and federal levels.
It should have been obvious to all, that the real infection rate has been much higher for quite a long time, as I stated and predicted in my first and second pieces.
The level of panic however, and hysteria was not there because the test results to panic over did not exist yet. Likewise, the fact that all of these previously mentioned gentlemen (and Mrs. Hanks of course), Tom Hanks, the Prince of Wales, Mr. Boris Jonson, and Senator Rand Paul will be, Gd willing, perfectly fine. This is despite the fact that they are men and not the youngest of people, which puts them in a higher risk group. And yet they will be fine. Does that calm anyone? Guess not.
What has been feeding this endless hysteria and panic has been our keeping track of our arbitrary “testing” curve rather than the real curve. So the two curves exist, and can intersect at any point at all. For example:
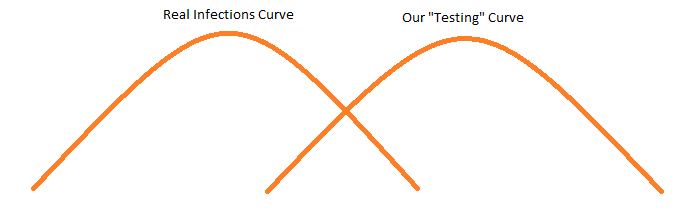
We can see in this arbitrary example, that the real infection curve started at some point (before we were testing), peaked, and is now rapidly coming down. However, as we test and test more cases, and keep finding more cases, the curve we see looks like it’s rapidly climbing and only at the beginning. If we zoom-in to that relevant point:

The blue arrow indicates what we would see, number of cases rapidly rising, where in fact, the real number of cases, indicated by the green arrow, could be rapidly dropping.
In reality, these could look very differently, for example:
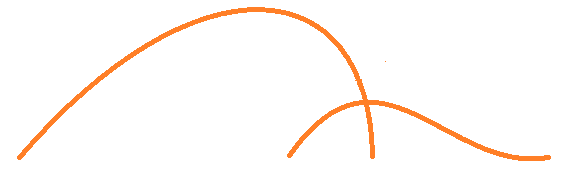
The real infection rate could have been rising and then sharply started to drop as either summer, the lock-down/social distancing, or the virus simply having ran its course kicked-in at some combination. Meanwhile, our increase testing would still see this sharp drop as an increase in cases until later on, it too would start to fall.
In New York for example, the percent positive results on tests seem to have increased from near 0 to about 1 to 2% in early March then rising to 3% for a short period, and then quickly going up to 6% to 10% on any given day up until March 20th . Note this is similar to the 12 to 13 percent positive rate seen in Israel thus far and mentioned earlier. This may indicate that true infection rate was in effect rising at that time, or it may indicate issues with testing. For example, the previously mentioned reporting of early tests including a large percent of false negatives. In any event, by March 20, serious lock-down effects were in place, and so unless everyone is simply spreading the virus by going to the supermarket and enjoying deliveries (while stupidly walking around with useless gloves and masks), then the infections should be dropping fast after that.
So what was happening in places like Italy and now New York?
Well, without rehashing much of what was mentioned in previous articles, I will add a few points.
Firstly, I pointed out that it was very unlikely that Italy’s death toll would go over or much over the 1,800 people a day that unfortunately die there each and every day under normal circumstances. In fact, that is what has happened and numbers peaked around 800 to 900 a day and are fast coming down already.
The point was made that people were dying, with the covid virus, and not necessarily because of it. Of course, the terrible health care system in Italy was not helping, and neither is the fact that hospitals, the very places where very sick people go to in order not to die, have become hotbeds of the virus. All sickly and dying patients are getting infected in the very medical facilities they frequent to save their lives. Hopefully, they have put in place precautions to end that. This is why it is imperative to separate regular patients from the covid19 patients, and as soon as that is done (such as is being suggested with the hospital ships off the New York and California coasts), the number of deaths that they can attribute to COVID19 will likely drop drastically.
A recent Japanese study clearly shows how much more contagious the virus is indoors than outdoors, basically a 20 times higher infection rate indoors. This is why planes, ships, and hospitals are among the places this virus, like others, has spread the most efficiently.
As mentioned in my previous piece (which I keep having to refer to, you should read it!), one of the theories about summer vs winter infection rates for similar respiratory viral infections has to do less about the weather itself, and more about how much time people are huddled together indoors.
The UK is perhaps further behind in the infection rate curve than some other countries we have mentioned (despite the fact that their Prince of Wales, and the PM are among those infected), but it happens to be a country that issues death rate data on a weekly basis.
If in Italy for example, it was an additional 800 people that were dying, rather than at least in large part, 800 out of the same 1800 people (and as mentioned previously, it is actually typically more than 1800 during these times since the daily average is 1,800 but more people die during the winter flu season than at other times) that die there on a daily basis, the weekly statistics would show a massive mortality increase of course! We do not have on hand this type of timely data for Italy, but we do for the UK. Below are the last 3 weeks of UK data:
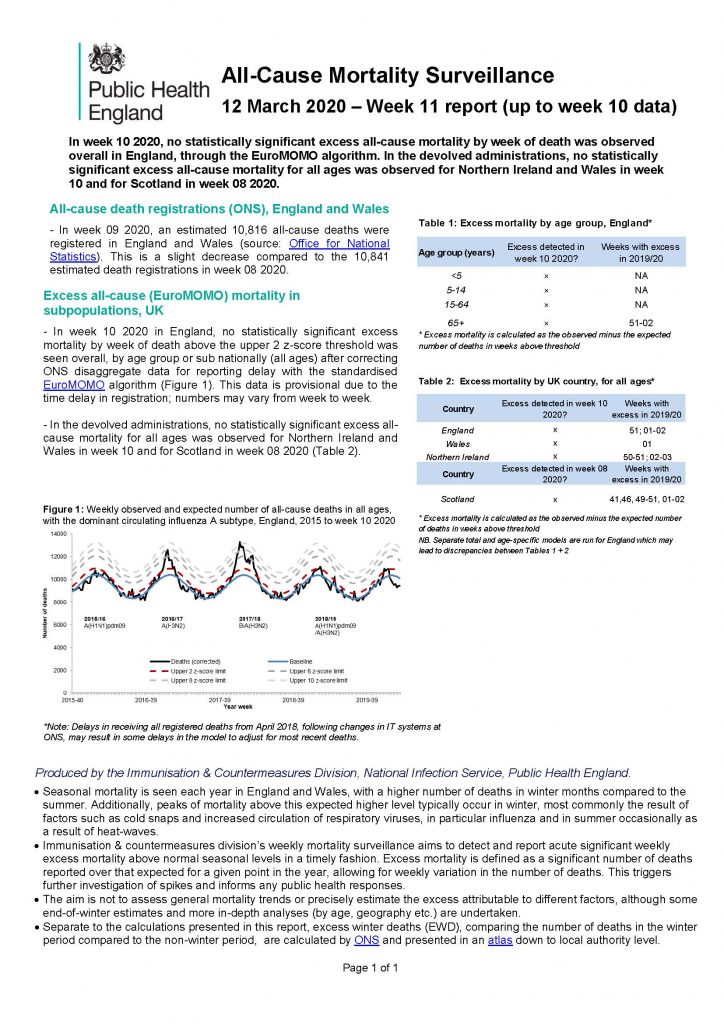
and for Week 12:
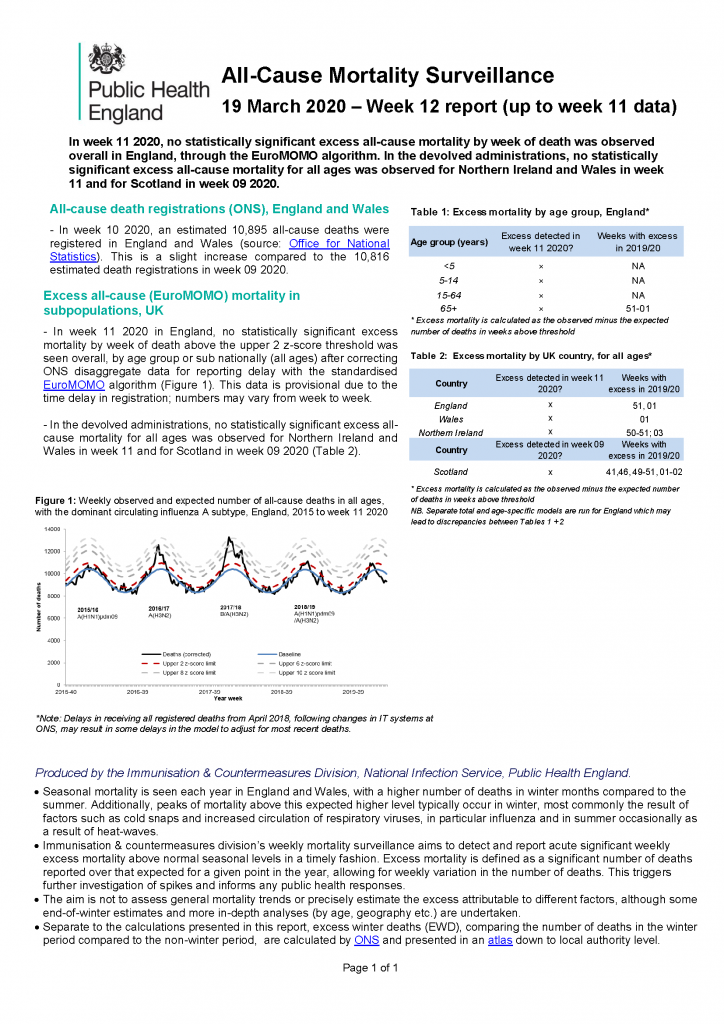
and for Week 13 fo 2020:
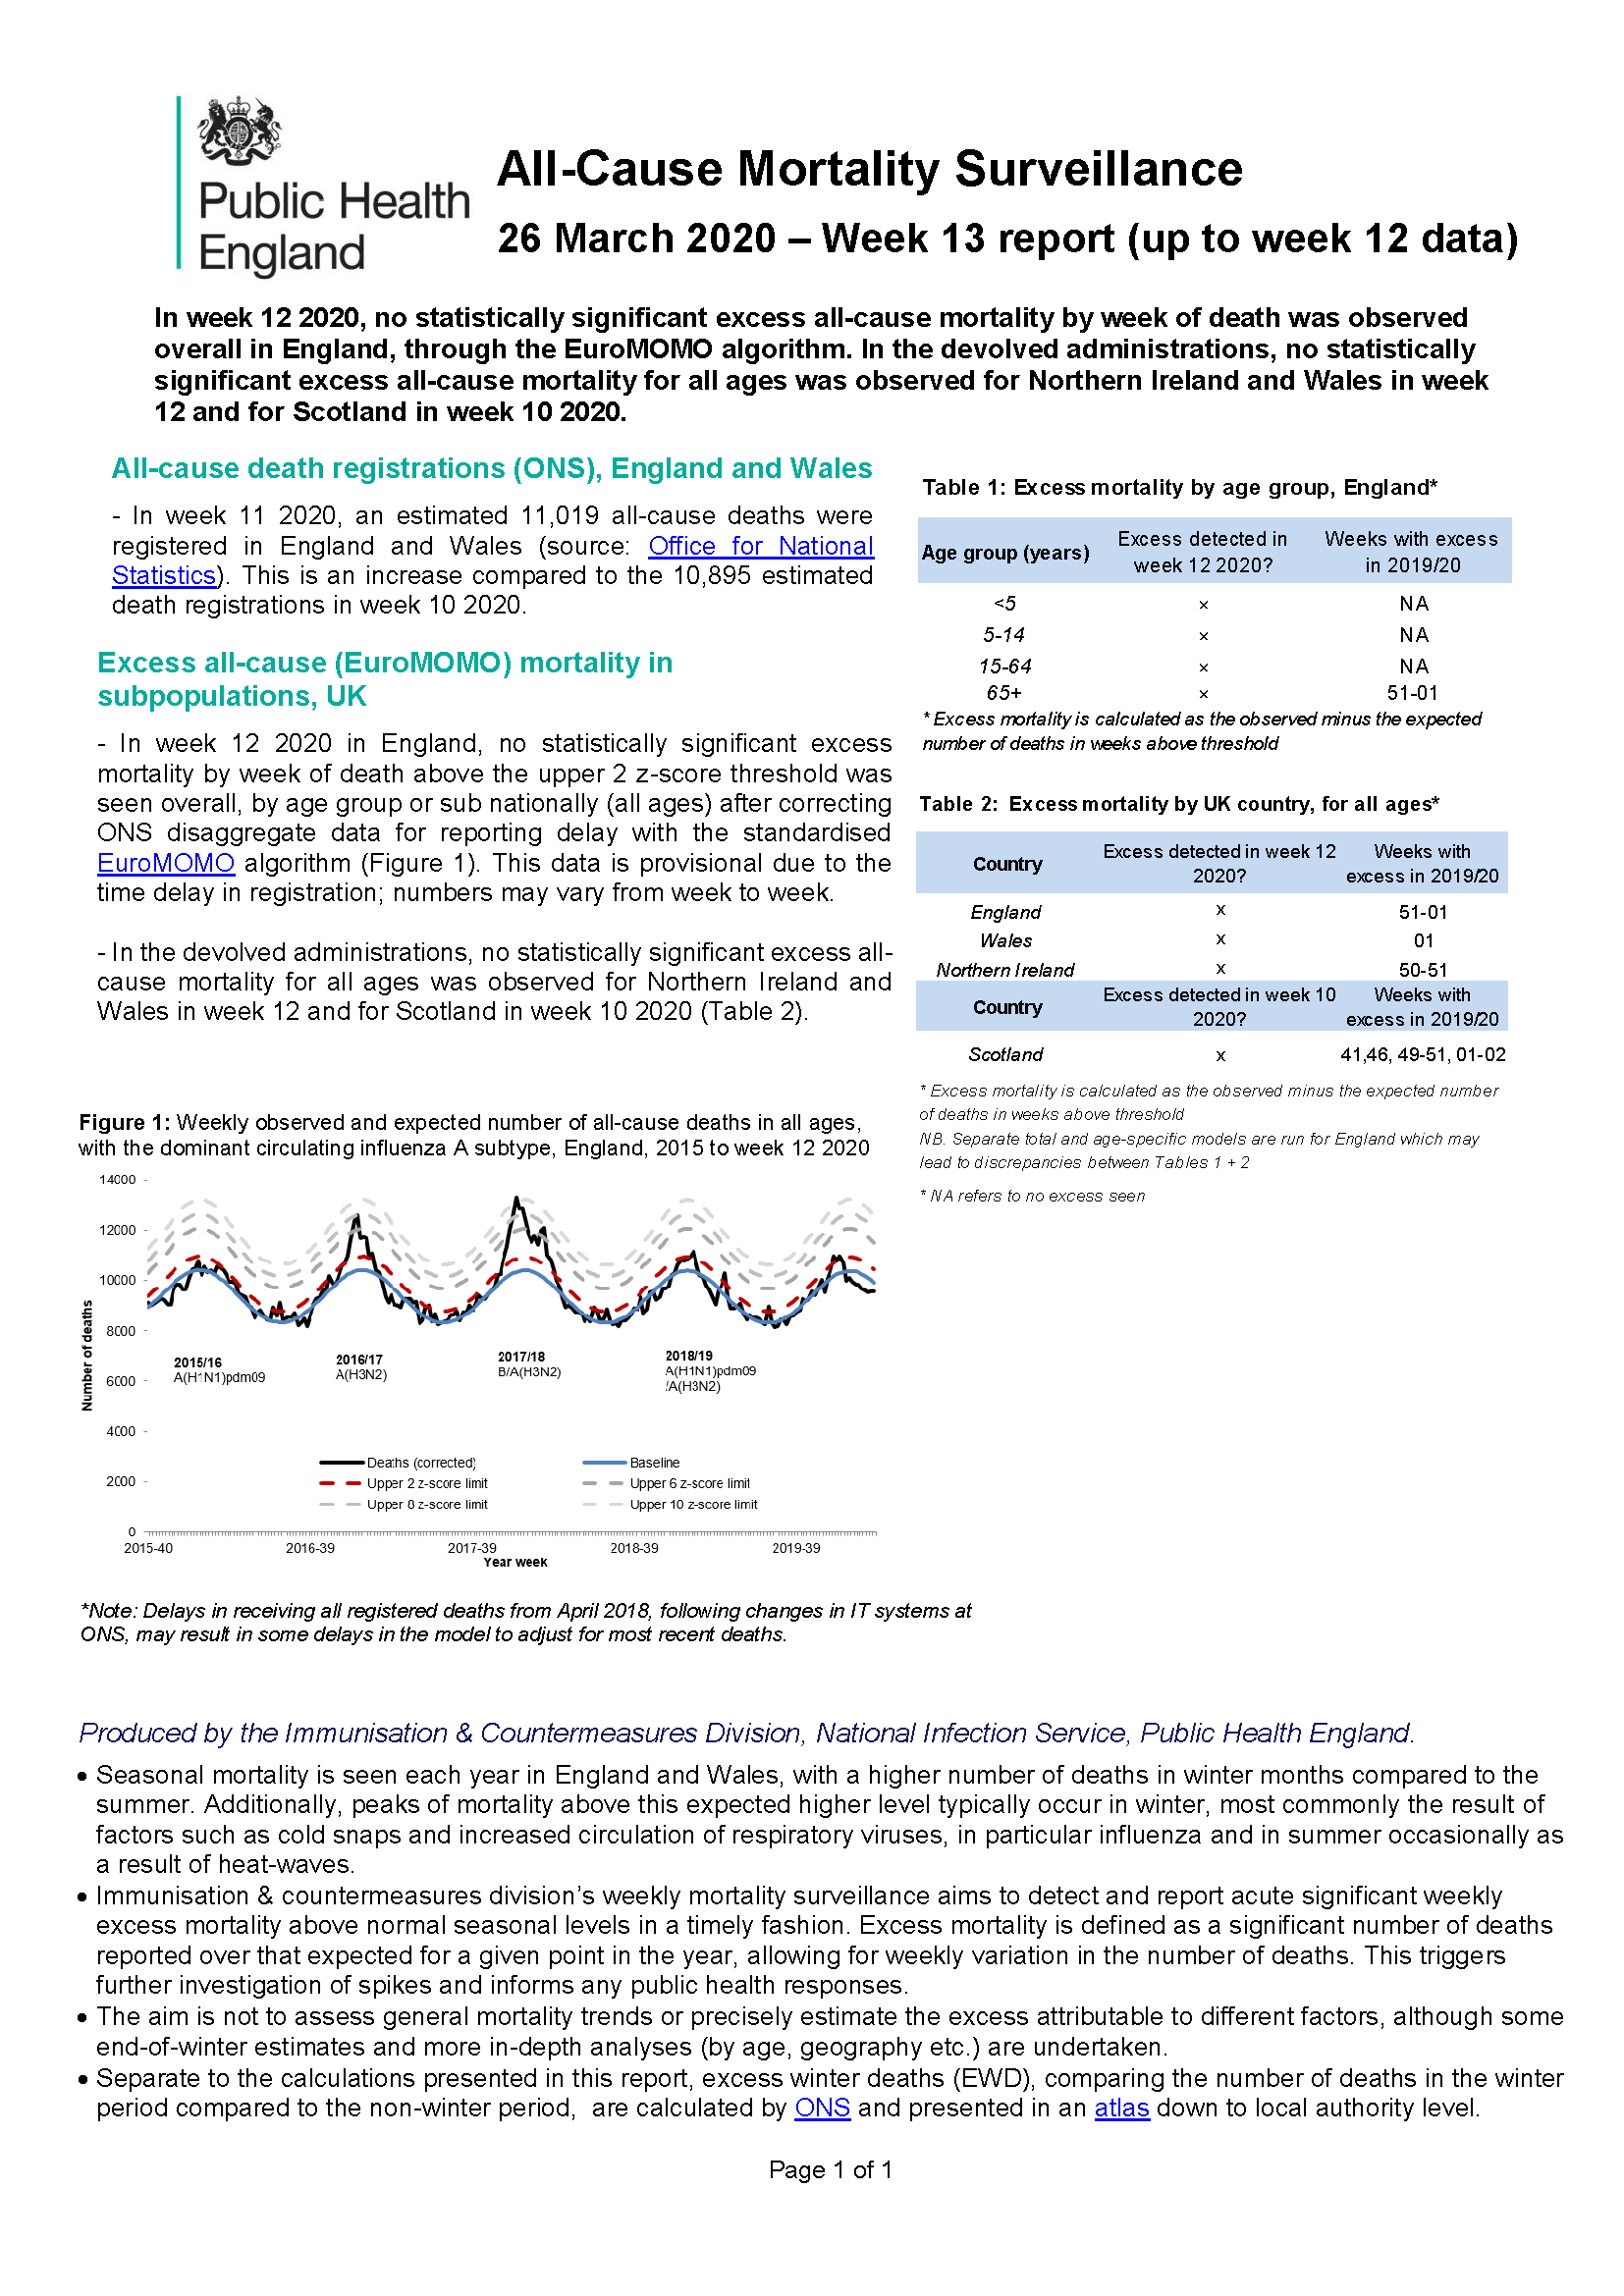
Mortality rates thus far for England are statistically the same as expected. At least thus far, the virus has caused no difference statistically speaking. And in order to justify the panic that we have been seeing and the destruction of our economic system, on which we rely on to live on a daily basis, you would expect a great spike in weekly deaths due to this mighty plague.
I expect, that the end result for the year, even if certain weeks are somewhat higher in death rates, which we still to date have not seen, will not be very different than any given year… because again, what is mostly happening is that people are dying with the covid virus rather than due to it. Of course, it does make the difference for some, much like any myriad of infections, both viral and bacterial can and do each year.
Take a closer look at this portion of the UK’s week 13 report:
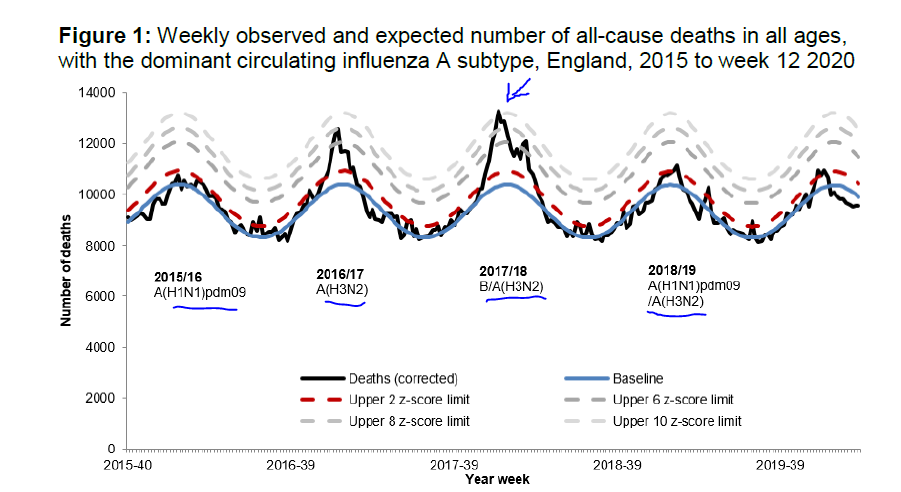
The standard format talks about the viruses going around that season, and has not been updated yet for covid19 of course. Notice that very significant upswings in deaths during the winter months, and the dominant influenza strain largely causing it named specifically. Influenza and other respiratory infections, increase mortality in at-risk populations during the winter season, specifically among the elderly but also among the young (unlike covid19 who largely spares the young).
These are swings of thousands of deaths in the UK alone, which typically go ignored by the media each year. A six thousand death toll swing from the bottom of the baseline in a year like 2017/18 in only those few months, when the UK is reporting 1,400 total deaths due to corona thus far. And those 1,400 are not necessarily excess mortality, or a “swing” above any baseline but likely in large part, simply part of it. Because as people have forgotten in this hysteria, people, unfortunately, die.
Now New York
If we turn our astute eye to NY, we will find similar findings. As of yesterday, NY is reporting 60,679 confirmed cases and 1,063 deaths since the beginning of this COVID-19 outbreak.
The state of New York suffers from about 152,940 deaths per year (based on 2017 numbers reported by the CDC)
After diseases of the heart, cancer and unintentional injuries, chronic lower respiratory diseases at number 4, and Influenza and pneumonia at number 6, are the leading causes of death.
Following that, number 7 is Diabetes and number 9, hypertension. As you can see, the leading “underlying symptoms” which the media is reporting puts you more at risk from dying because of COVID19 are themselves the leading causes of death!
Here are the comorbidity statistics as reported jointly by China and the WHO:
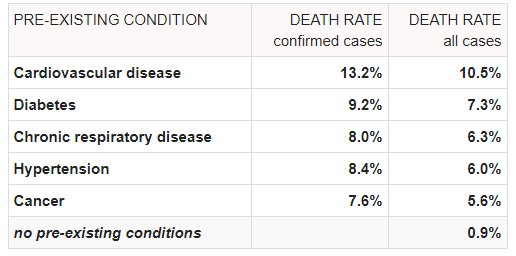
Recognize them?
In fact, even the influenza numbers are very subjective because while they are 4,517 deaths for 2017 in NY, a much bigger 7,258 are due to COPD (chronic lower respiratory diseases). The majority of COPD cases are Chronic Bronchitis, which itself is chiefly caused by viral or bacterial infections (influenza included) of the respiratory system.
And of course both of these are relatively small compared to the many more thousands that died of cancer, 34,945, or heart disease, 44,092, not to mention all other causes of death. Who is to say how many of those cancer patients at the time of death would have tested positive for this or that viral infection or bacterial infection?
It just makes little sense to say that a person dying of terminal cancer, died of the flu. But this is what is happening during this covid outbreak.
The state of New York has had a bit over 1,000 deaths “with” the covid19 virus, and not necessarily “because” of it. It needs to reach about 4 times that to reach the number of deaths in which Influenza and pneumonia were characterized as being the most important cause of death in a given year, and more than 9 times that to reach the yearly number of deaths for Influenza/pneumonia and COPD together.
COPD, should not be dismissed out of hand, and in fact it is not only caused by and related to respiratory infections, but puts people with the condition at a much higher risk of death with further infections. For example, the West Virginia Health Statistics Centers quotes study relevant study results including that “
Influenza and pneumococcal vaccines can also be beneficial in reducing mortality in COPD patients; one study showed influenza vaccines reduced illness and death by approximately 50%.
It also tells us that it has been estimated that 10% of the population aged 55-85 have COPD, and that:
and our aging population is one reason for the increasing morbidity and mortality from the disease
Just like older people, or anyone for that matter, is at greater risk of death from the influenza virus and other respiratory infections, is it a big surprise it likewise the case with COVID19?
So in NY 9 times more largely wrongly attributed deaths would reach the more correctly attributed yearly deaths in NY from COPD and Influenza/pneumonia. Who knows how many times more it would need to reach the number of deaths a year who would simply test positive for a respiratory tract infection such as influenza at the time of death. That is a number we do not know and likely won’t know, but it is how we are reporting COVID-19 deaths at the current moment. Lunacy.
The total death rate is around 780 to 800 deaths per one hundred thousand people. In New York state, as previously stated, it meant 155,358 deaths in 2017. Even if you remove accidents, 7,687 and suicides, 1,696, the remaining number, 147,671 is virtually all due to some medical condition or another. That means 404 deaths per day on average, which in fact, just like we saw with the UK weekly mortality statistics, are at a peak during flu seasons, and lower in summer months.
Despite this fact, NY has declared a total of 1,400 or deaths due to COVD19 (or more accurately, with COVID19 since that is how we are doing things now), even though this has been going on for weeks and now months. While ten thousand people are currently hospitalized, also with COVID19 (it quickly becomes a large percent of people hospitalized since that is where it spread rapidly unless extreme safety measures are taken), 5,000 have who had it have been discharged. The true number of cases in the state must be staggering, and nowhere near the 70,000 that is known, but we of course do not know it. Like in Italy, you will see that the declared COVID death rate will not by much surpass, if it even approaches, the normal medical death rate of about 404 cases per day in New York. It will not be the double, triple and 20 times the daily death rate you would expect from a plague matching the level of hysteria and panic in the reporting. This is because, like in Italy, many of the reported deaths are people dying with the virus rather than because of it.
In Israel, a curious case occurred that illuminates this point. A 34 year old man, who had tested positive for the coronavirus, proceeded to jump from the third-story window to kill himself. He was in the hospital and it was announced that he was in the final stages of treatment. He failed in his suicide attempt, and he is now in serious condition due to the fall, and of course still infected with the virus. Whether this was a man prone to suicide already, or was driven to it in light of the hysteria in the media and the news of his testing positive, is not certain (perhaps he was so scared of the virus that he just wanted to extend his hospitalization by non lethal injury!) but we face an ironic end result.
If he recovers, it will be odd to many that a man hospitalized for the virus can jump out the window, putting himself in serious condition, and still recover from both without issue. If he dies, let us hope not, I will like to note if the authorities add him to the coronavirus death-toll as they typically do, or will this one best be left in the “suicide” column. Perhaps more accurate than either, would be homicide by the media.
In any event, back to New York State fatality figures. The accident fatalities will likely diminish, at least for these weeks and months, since activity of all type, work, sports, and travel have been curtailed. On the other hand, suicides might certainly go up due to this hysteria and economic destruction! But the overall death rate, those two aside, will not be much different than it is on any given year. Time will tell.
I will not go on about the economic issues in this report since it was meant as a more brief update regarding newer data, but as a note to those who may think the world has ended. It is perhaps so in the sense that my posts and writings typically complain about, that the core and the soul of the western world is constantly being weakened and eroded away, this panic is just another manifestation of that malady, but that has been going on for a while now. Nothing fundamental has changed with this episode, and this virus will soon too be forgotten. Whether it comes back for the next few seasons, or becomes endemic or disappears altogether, with a vaccine or without it.
So now what?
Finally, I would like to point out that in many places in the world, the peak has passed. As mentioned before we have the testing curve and the real curve, and as we test more, we keep finding more cases each day. At some point however, even as number of tests increase the daily positive case count will be less then the day before, and so on. At that point, the infection rate will drop rapidly. And finally, the fact that while we are testing more, we are finding less cases will dawn on even the crudest of doomsayer reporters, and it will become evident that the worse has passed (so that they can maybe open up the world for business again before all small businesses have gone broke).
Many hours ago, I called this point on a Twitter post.
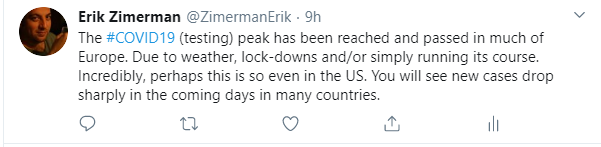
Not that to date I use twitter much, but wanted to get that across before writing this piece.
Though as mentioned before, positive tests were increasing in NY up until March 20th (up to when we have decent data from the CDC), I believe even NY will start to announce a diminishing number of new daily cases starting yesterday, today or tomorrow.
In Europe, countries like Spain and Italy are passed the peak and their daily new case number will continue to drop rapidly each day I believe. These headlines will be seen starting probably as early as tomorrow as the trend continues. This is likely the case also for Switzerland and other major European countries, though perhaps not yet for the UK, which may be behind in the real and/or test curve.
For the US as a whole it is difficult if not impossible to say, since it is so large and so many areas may have such a varied amount of cases, and that data is simply not there yet. It could be just the beginning for many parts of the US, or not. However, in NY at least, I believe, with less certainty than in Europe, that the slowdown in cases will also be seen in the coming days quite rapidly. This will be the case in Israel as well. Testing is increasing very rapidly, and the number of cases are not doing so as much.
I hope that these welcome news, will ease the panic that is close to suffocating the lifeblood of our economies. And though I know to many people, the “economy” is something wealthy capitalists worry about, as some ethereal body out there.. it is actually a very real thing that allows all of us, especially (rather than indifferently to) those of us that may not do very much for a living, to be alive.
We are not by nature as imaginative as we think we are. And just like it was impossible for people to have imagined a western world gripped by panic due to the circulation of a respiratory infection caused by a novel strain of the well-known coronaviruses, it is now impossible for many to imagine a world that is not gripped by this same panic. But people will forget to panic, as quickly or at least almost as quickly, as they panicked. We will move on to the next crisis the media makes up for us.
EndGame
Before signing off, let us look at something very concerning, which in fact is what I have argued is the cause of all of this; government policy.
Private companies have budgets, goals and schedules to meet. They must develop strategies for the long term, and adjust them based on the developing facts. When they fail to do this, they go bust. Governments just go on and on, much like the DMV. They respond haphazardly and at a whim. And while I hoped for a quick shut down to “flatten the curve”, this has turned into something much worse entirely.
As explored briefly in the previous pieces on the subject, President Trump may have simply made some strategic political calculations, and regardless of what he thought of the pandemic, played a strategy. In my very first article, it was noted that he may be turning to a “Fake Plague”, “Fake Cure”, “Fake Victory” strategy. You guys want this crisis, no problem we will defeat it. That kind of thing. That turned out to be the case as he pushed certain remedies and measures. Then he tried for several days to warn about the economic doom and get everything reopened again. When this apparently proved politically impossible, he switched sides again to push for a more complete lock-down of New York and New Jersey, which the local Democrats in power rejected.
Trump usually is very good at playing this hand. Having noticed that the media and the left must attack everything he does, he often places them in very uncomfortable situations, such as defending ISIS, or Qasem Soleimani and the like. So this felt like a similar move, he was pushing for More caution, but the Democrats, including the Governors, rejected it. They did not want to be responsible for it.
So far, these mix of strategies are working politically, as he is reported to have a higher rather than lower approval rating. The public believes the media hype on this virus, but they are not so foolish as to believe that the virus itself is somehow Trump’s fault (the way a storm (Katrina) in New Orleans was Bush’s fault).
The political price for not appearing to do the maximum here may have appeared insurmountable. The media finally found Trump’s Achilles heel. If you did not burn America down in the process of stopping this covid virus, the media will parade pictures and stories about the infected dead. Be it one man, one hundred or one hundred thousand it would make no difference. Cause of death attributed correctly or incorrectly would also make no difference. This person or persons are dead because our president doesn’t care about the American people.
Furthermore, I believe they feared that if the Federal Government pushed for everything to be open as usual, the state and local governments could and would effect closures in any event. Personally I believe this would backfire for those local governments… there is only so long you can shut down Los Angeles, destroying its people’s livelihoods, while much of the country is going about its business as usual. At first local governments would do that, but pretty soon, reverse pressures would be exerted on them to open everything up. This would have been quite genius.
In any event, this is not the way the administration went and instead the line of thought being developed I believe is that, if this will cause the economy to crumble, and Mr. Trump was willing to bear that in order do what had to be done, then surely it is also him, the man who presided over such a robust economy for his entire term after such a long economic malaise, that ought to lead the country in the recovery, rather than another economy-depressing Democrat. I believe they are already thinking something along these lines, and purposefully jumping on the doomsday bandwagon, in order to achieve a “win-win”.
Trump is also more limited here due to the subject matter. It is difficult to ignore your “experts” in this issue, even when Trump has had the political success he has had largely by ignoring the conventional expert political advise. In this case at least, it seems he has taken this conventional strategy approved by his experts.
Not sure if that will work or not, but it certainly puts the administration on the hysteria bandwagon. One would think that later it will be in no one’s interest, to admit that it was hype or that the actions were over-kill. However, that would be the case if the media, the public, and politicians displayed any long-term memory; they don’t. And if the epidemic in the US passes largely benignly, and the economic consequences are dire, the Democrats will quickly turn on Mr. Trump’s actions nonetheless.
If you do not think so, recall the years-long near universal condemnation of President G. W. Bush on the Iraq war, after the “war resolution” was passed by a Democratic Senate, with 77% voting in favor (58% of Democratic Senators voted in favor along with 98% of GOP Senators). This is not to mention the 64% of the American public who, by 2003, supported a US ground invasion of Iraq.
This is all troubling because of the following. If the goal was to “flatten the curve” as we have been endlessly told, then this is firstly, a recognition that the virus will spread throughout the population (if not to everyone), and a goal that merely aims to slow the rate at which this happens. The total numbers under the curve are the same, but it is flatter or less steep.
Unless you believe that summer will completely eradicate the pandemic, which it could, or that a cure or vaccine is imminent, then flattening the curve is simply slowing down the spread of the virus, not diminishing its spread. It means that society has accepted the virus exists in the population.
Eventually, weather by mere herd immunity, a vaccine, summer, other factors or a combination of them the outbreak can be completely eliminated, but flattening the curve for the meanwhile is accepting that there is a curve, and yet that we can continue with our lives.
What is very troubling is that this is being forgotten, to make matters even worse. This flattening of the curve is achieved by a diminishing of social interactions and high-contagion events, but not a complete lockdown.
So large gatherings like concerts and cruises are cancelled, the public is directed to be cautious and avoid contact with others. Hospitals and other crowded indoor places put into effect measures to diminish viral spread, which “flattens” the curve. Of course, all those with the virus are quarantined. That kind of thing.
If everyone goes into complete lock-down… and then the number of new cases eventually drops (despite ever increasing tests as we have discussed), and then everyone comes out again, then the just-as-steep curve will start all over again!
It may in fact not do so, because everything they are telling us is wrong. If the cases had in reality already been so high that now there is complete herd immunity, or due to the summer weather or other factors which according to governments and the media do not exist, then it may very well not come back. But if we believe what they are telling us, the strategies not only make no sense but have no endgame!
Let me explain. According to officials, .06% of the US population has contracted the virus. So 99.04% of the population has not, and so if we all come out of lockdown after the cases have greatly diminished in the US and elsewhere, as long as there any cases left, the curve would start to climb just as steeply as it did before! For this strategy to make any sense, it would have to to some very extreme lengths.
It would require a complete lockdown until the virus is completely eradicated from the earth, and I fear that could potentially mean a long wait! Previously discussed, was the fact that new cases per day will be dropping in many countries now. If the lockdown persists, one would think that these will keep dropping but they will not soon get to 0. And even when they do, zero cases among the tests taken on a given day does not mean a real 0 in the entire country. So a lockdown all the way to sterility could be a long lockdown indeed.
Even once that is achieved, if the country can still exist at all after the complete economic collapse this causes, other countries have not yet reached zero. So trade, commerce and travel cannot start back up again as normal. You cannot even allow travel to and from a country who also appears to be covid19-free, as long as that country is allowing travel to others who are not yet so (or even to others who accept travel to others who are not yet so… ad infinitum). So travel has to be disrupted if not completely stopped for how long?!
China has gotten over this virus, and the daily cases found at present are minuscule for a country of some 2 billion people, but they are not zero. New cases are found each day (mostly they claim, from cases being imported from abroad).
If all this was not enough, pretty soon you are passed summer, and if the virus has survived only in the southern hemisphere, it will likely now spread rapidly once again in the northern hemisphere as winter flu season approaches. This is why influenza is never stopped! Now, if this particular COVD19 strain cannot change antigens like influenza viruses (really just a matter of classification) do, then this particular strain of coronavirus will likely disappear altogether as immunity grows. But if it can, it simply becomes endemic like many other similar viruses.
Truly dangerous viruses are much more easily annihilated. Because we must annihilate them. MERS for example, is reported to have a 30% death rate! Not just of the elderly or people at risk, that virus will actually kill people in shocking numbers. Because of that fact, it is clearly evident when a person has it, since he starts to die! This makes it not only easy but imperative that he be isolated, along with those he had contact with. Pretty soon, outside of local outbreaks it is contained, and then gone! But a weak virus like COVID19 who can be around the world before anyone even knows, is very difficult to to contain, and if you suddenly try to by half measures, you’re heading down a bad and foolish path. The economic damage is easy to do, eradicating the bug that already spread around the world, not so much, especially when you are being told you can go to the supermarket all day along along with everyone else, but just not the movie theater.
The point being, that though I am encouraged that the peak is passed in many places and the end nearer than people think, this means nothing if the sentiment has changed to one demanding a “COVID19-free world.” If that is the case, there may little left of our countries after that is achieved.
So what should governments do?
Well, as was explored previously, once initial containment was not achieved, the best option was not to do much of anything. If you really want to, you can aggressively isolate and quarantine those that have the virus and make sure hospitals do not become hotbeds of infection, especially for the very ill that routinely are found there. This will be helpful not just for covid19 and other respiratory infections, but all sorts of infamous super-resistant bugs that hospitals are full of. They routinely infect those of weakest health among us who not only and obviously often find themselves in hospitals, but who can also least tolerate them. Of course the elderly, and the otherwise at-risk should be encouraged to self-isolate.
But now that we are way beyond all that, if you are speaking about $2 trillion dollar packages to revive the economy you destroyed, then there are much more efficient and creative ways.
For example, we have discussed thoroughly how testing is the key to all of this. The more testing you have, the more reason and logic that can be applied, and the less hysteria and panic. More testing lowers the perceived death rate as we have shown. More testing also allows you to stop the spread as the bulk of cases, which are mild or asymptomatic, can be isolated.
So heck, for much less than $2 trillion dollars you could have tested everyone!
If my back-of-the-envelope calculations are correct, 2 trillion dollars (to start with, let’s see what other measures are passed going forward!) equals about $6,112.46 per man, woman and child in the USA! You can certainly test everyone for far less than that… you could probably test everyone for $20 per person! No? $100? With America’s giant resources, and some effort and resourcefulness, bidding out contracts to the massive medical private sector in America, this should be no problem at all.
Other countries, especially smaller ones, and richer ones, can also achieve this. And after that, testing can be required for a time for all travelers to and from different countries, which will allow regular commerce to be opened once again.
And testing should be done for the antigens (showing a person had the virus in the past and are now immune) as well as for the virus itself.
Anyone shown to have the antigens could go about his business freely, and shore up the economy. People testing positive could be quarantined, and for those testing negative there are several options.
You could say for example that anyone testing negative for the virus, but also negative for the antigens (meaning he is not immune yet), has to quarantine for 1 week. If after 1 week he is fine, out he goes. If you want to exaggerate that, it can be the full 2 weeks (and those folks can get some government help for their 1 week or maximum 2 week quarantine). You would still be way under the $6,000+ figure per person of the current package (let alone per household where the figure stands at more than $15,300 per household).
The tests exist and are available. A solution along these lines would have been, and still would be at the rate we are going, a much better path.
There is little interest in doing this however, in part because it carries a huge political risk. Mass testing of the antigen and of the virus, can reveal just how widespread it actually was, and thus likewise how unnecessary all of these measures that are destroying the world economies really have been.
April 1 2020 Update
Very early on March 30, (perhaps still the 29th in US Pacific time), I predicted that the peak in our fake “testing curve” which the media is calling the real infection curve, had either been reached or passed in many key places, Italy among them.
This is because it was becoming evident in many places, that despite the ever increasing number of daily tests, the number of cases found daily had plateaued, and even showed signs of starting to decrease. For tests to increase, but cases found to not increase but stay the same, requires a very sharp decrease in the real amount of cases out in the population (see above “fake” and “real” curves explanation).
You must remember, the media constantly reports the total number of cases found in any given area or country, since the very beginning of the outbreak (or at least the testing of the outbreak), and the total number of deaths since that same beginning. These numbers can never go down, they can only increase!
When the last patient on earth tests positive for the virus, that number will still increase by one. It cannot be reduced.
However, what is much more important is the number of daily cases found, especially in relation to the how many tests are being performed on a daily basis. These numbers dropping indicate the beginning of the end of the curve.
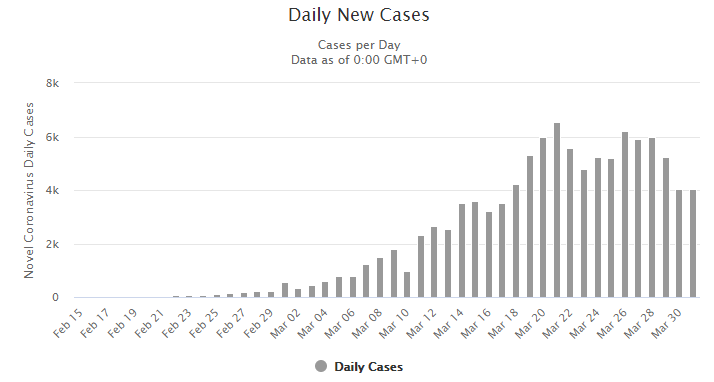
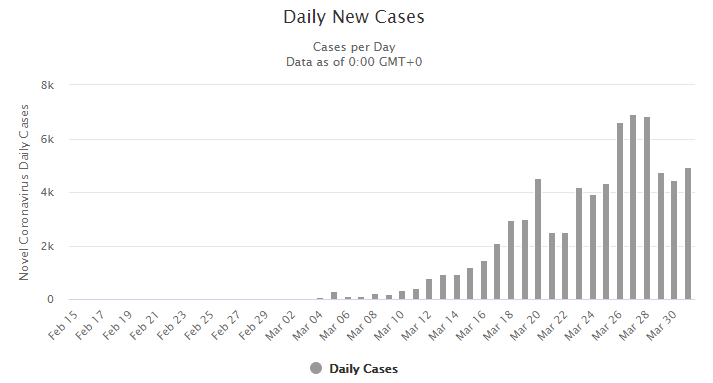
So, shortly after my article, Italy announced the following:
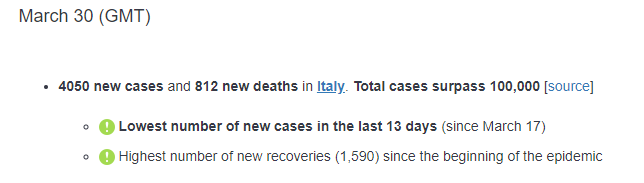
and their daily new cases are rapidly heading downwards (as their daily recoveries continue increase):
For Germany, it is still to early to tell, but despite their testing being up to a half a million tests per week, the number of cases is now surprisingly small and seemingly dropping. My bet is that it is soon on it’s way down in Germany as well (having maintained its very low overall death rate).
Switzerland, likewise, yesterday reported 638 new cases, which is the lowest number in all but 1 of the last 12 days. The Swiss, also have released this document, which has the daily number of cases by the date of the sample taken:
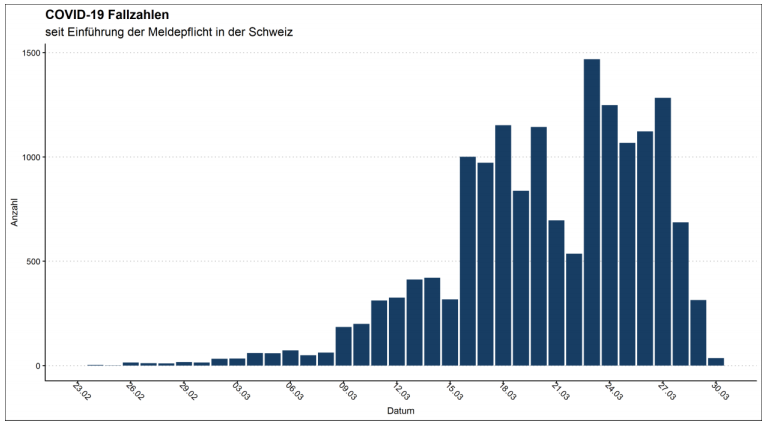
Clearly, we see numbers dropping very fast, even if we account for some delays in the testing results on the last day or two presented.
Note that they mention that the average positive test result for sample is about 13%, the same 13 percent or so that we found elsewhere, including in Israel. In New York state as we noted, the positive test rate had increased to 10% by March 20, 2020 and probably increased up to around 13% in the days following (which we still don’t have final data for). Just imagine if about 13% of the population in Europe, the US and the northern hemisphere in general at some point in the season have contracted this virus infection?! That would be more than 854 million cases! Saying nothing of the southern hemisphere.
Interestingly, that is about the number of cases we typically we see of the flu each year.
As we calculated in a previous article on the subject, if you want to reduce this rate by a factor of ten, to accommodate for the fact that people who are feeling sick (or traveled or whatnot) are more likely to be tested up to this point… very well. Even though the vast majority of covid19 cases are mild and/or asymptomatic, no problem, that would be a 1.3% infection rate, rather than a 13% one.
That would mean only 85.4 million cases throughout the world, no, correction, the northern hemisphere alone, compared to the 885 thousand reported thus far world-wide.
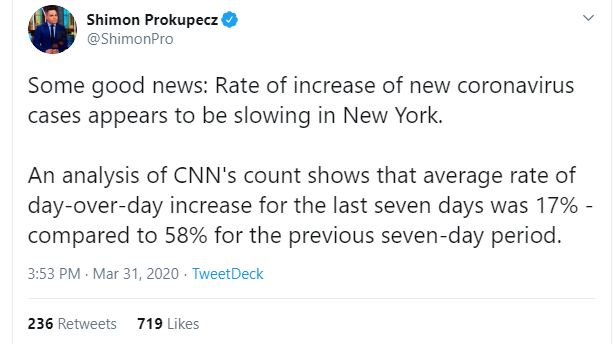
I had gone on to boldly predict that even in NY, while the media was shouting armageddon, and even the administration estimating a peak in 2 or more weeks, the daily new cases would be dropping in the coming days. That apparently is happening as well. For example, we have this observant reporter, with 100k+ twitter audience who speedily covered the phenomena only hours after I predicted it.
So there you have it, the “testing curve” peaks are or soon will be behind us in most countries. And the declines will be sharp and fast because the real curve is already in steep decline in those places. The US could be another story, it is a very big place where the virus could have gotten to various regions at very different times. And testing has been dismal up until the present.
First a brief word about the 200,000 death toll being thrown around by the administration and others. It is playing the same games as Italy and New York (to be more precise, it is doing that now that they tweaked it from the previous astronomical numbers they had, 2.2 million dead Americans). Perhaps better said in the case of the Trump administration, it is setting up a protection for the same game. The 2019 US crude death rate was 8.84 deaths per 1000 people. With it’s 327.2 million estimated population, that means 2.892 million deaths in the US for the year, or 241,000 per month!
So yes, given the propensity to attribute nearly all hospital-deaths due to the virus in an environment of high infection rates (especially at the hospital), the worse case scenario is simply assuming 200 thousand of those deaths are attributed the virus. That would be 82% of the deaths of any given month, or 41% of the deaths in 2 months. As is the case in Italy and in NY, the problem with this is that these would be largely the same people. The inescapable fact of life is that about 240 thousand people will die in the USA this month, and next month, and the month after that. With or without this virus. It is another example how the death toll reported never exceeds or approaches the daily, weekly or monthly expected death toll in that same region. Something that would certainly happen in the grip of a deadly plague such as those that have routinely killed great percents of the population up until relatively modern times. What you will not find is that for a given month, the US mortality was 440 thousand people, the expected 240 thousand people, and then another 200,000 thousand killed by the virus.
Logic would tell us that California should be the epicenter more so than NY. It has a huge amount of international travel, much like New York, but dominates the Asian-US travel routes, and has a very large Asian population, along with the rest of the west coast of North America in general. And New York to California travel is also extremely extensive. Is it possible CA was the epicenter, and because it largely occurred before the media circus was in full swing, there is not as much fodder for it now as in NY? Indeed possible, and even most likely. And though hard to understand why it would be the case, it could potentially simply still be behind in the real curve, perhaps due to New York’s more crowded nature and demographics. But that would assume Europe happened after China, then NY after Europe, and CA after NY, as if it had no independent infection routes to these places when in fact it is a major hub and destination to and from all of these places, especially the originating one, China.
In any event, the peak is passed in many places and will be soon in others, but if the world is now so terrified of this relatively weak bug that we will only reopen for business in a sterile covid19-free world, we may be courting a long drawn out disaster.
I would hope that as the daily cases drop, the media will have no choice but to start reporting that fact, and economic pressures alone will compel governments to allow people to lead their lives once again. Time will tell.
Prediction
The major point in these series of posts on the current pandemic is that the world is largely playing with numbers to fuel this pandemic of fear. This explains the massively different death rates so far, even in countries that started the curve about the same time.
Germany is reporting 10 deaths per million people (total population), while Switzerland 56, and Italy and Spain over 200 (and China who is over the wave, only 2!). Dismissive of the People’s Republic’s numbers (as you ought to be)? South Korea, who is also largely over the wave, is reporting 3 deaths per million population.
The real death rates cannot and do not vary to that extent, this is, as I noted in my very first article on the subject more than 24 days ago (when data was very scarce), more a matter of how you test and how much you test. Both total cases, and deaths (how you register causes of death).
The IHME model that the White House is relying on has infamous predicted all sorts of death tolls in the USA that have sent the panic to all time highs, and spelled more certain doom for what is left of the economy.
They began by predicting 2.2 million American deaths, and as the data has not panned out in the model’s favor, they have continuously adjusted downwards. Half a million deaths, then 200 thousand deaths, and now at this point today, the White House has officially announced a prediction of 100,000 to 240,000 US deaths IF all the extreme measures are followed correctly.
Regarding the scientists involved, both in the US and in the UK, they are doing what they are supposed to do, as data becomes known to them, they alter their models.
However, their predictive prowess can be questioned, of what use is a model which is completely wrong, and continuously adjusts until it matches the final real life numbers at the end (and thus proves correct!)? Not much.
So despite the fact that prediction in this context has more to do with how statistics will be recorded and presented, more due to legal, bureaucratic and political factors rather than objective measures of reality, I will boldly venture into this game. I have written quite a bit about this subject, and pointed out the many factors wrong with the current reporting and general way of thinking, but now will put this analysis to the test and unwisely venture into the thankless task of prediction.
We have the following present situation and expert prediction from the White House in summary:
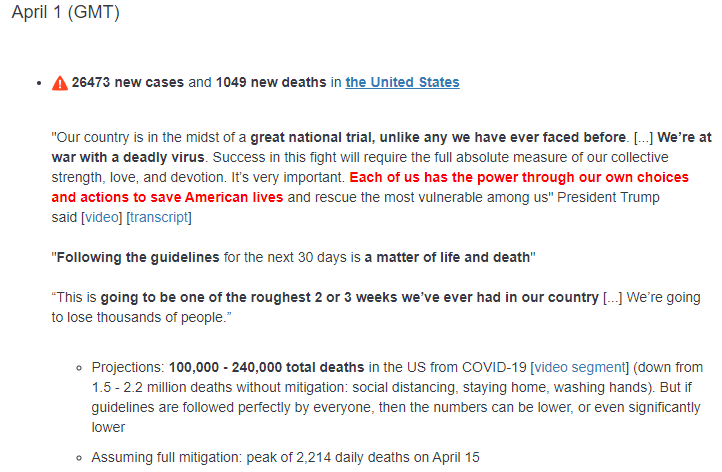
One hundred thousand to 240 thousand is of course a huge range, (the higher number 140% more than the lower one). And then of course, a further caveat covering themselves in case the numbers are much lower. Meaningless since based on the model’s predictions, the US economy is being shut down.
The Lighthouse Keeper predicts differently.
The increase in new cases is already slowing in most of the US, despite the vast increase in testing. The same is true in much of Europe. Large parts of the US are not as packed together as New York is, and much warmer than New York is (like much of California).
Note that interestingly, while social norms and living conditions in Italy are often much more “dense” than in Germany, southern Italy has been warmer for much longer than northern Italy, where the worse infection rates have been seen. And even in densely populated New York, number of cases are diminishing rapidly.
As testing ramps up in massive numbers, new cases will, in the short term, shoot up sharply and fuel further panic. But in the longer term, they will decrease the reported death rate, and help isolate carriers further diminishing spread.
If they keep acting, recording and reporting pretty much as they are, meaning not as irresponsibly as New York, but not very well or objectively either, the COVID-19 death toll in the US (at the end of this wave, not up until the last case in history, nor of course in any subsequent waves) will likely be more around 50,000 people.
The same as is attributed to influenza in any strong season in the US (and all deaths were tested postmortem for the flu virus, those numbers would be much higher).
And if they do a good job in keeping the otherwise ill in medical facilities away from the virus, and use a more reasonable cause of death attribution practice in general, the number may be half of that. Significantly less fatalities than even this year’s flu season (winter 2019/2020) is estimated to have caused.
And even these numbers are possible due to the way COVID19 deaths are being counted or reported (shoot yourself in the head after testing positive and you are part of the count). And on the other hand, had they been testing all deaths since Jan 1 for the presence of the virus, the number would be much higher.
Of course, if my predictions prove accurate, they will simply attribute it to the extreme measures taken. On the other hand, if they do end up with COVID19 fatality numbers around 200,000, which I think unlikely, then you will find that the total fatality numbers in the US do not statistically show that these are additional deaths, but largely, part of them.
In the US, 2.839 million people died in 2018. A crude death rate of 8.73 per per 1000 people.
This was 25,702 more deaths than in 2017. The 2019 crude death rate was at 8.84, a bit higher.
In fact, since 2014, the crude death rate in America has been increasing by about 1.0% to 1.3% each on a yearly basis. This potentially due in large part at least, by the aging population.
In any event, to statistically detect a 50,000 death swing in the 2.8 or 2.9 million yearly death number will be difficult, and arguable. But once 200 thousand or more fatalities are being thrown around, then it will ought to be noticeable, that these fatality are either part of the expected yearly death rate, or in addition to them (or to what degree they are so).
Of course, this is if the containment measures don’t completely make that analysis moot with large increased fatalities. The rise in deaths related to an increase of suicide, stress, poverty, unemployment, crime, alcohol consumption and drugs, can easily dwarf these numbers.
Of course, traffic accident fatalities, and all sorts of accident fatalities (work and sport/leisure related) are likely to be much lower for at least the lock-down period. Deaths which occur, when the individual accepts the inherent risk, in order to live his life.
Without commenting on any particular study on the matter itself, but just to note an awareness of this issue, many studies show a very worrying correlation between unemployment and higher death rate. Just as an example, this 2014 study shows unemployment correlating with an 85% increase in mortality rates for men (even after accounting for other variables)!
Applied to some of the current unemployment projections, this alone translates to many millions of lives!
As is stated by Brad Pitt’s character (Ben Rickert), in the Big Short:
If we’re right (about the housing market collapsing), people lose homes. People lose jobs. People lose retirement savings, people lose pensions. You know what I hate about fucking banking? It reduces people to numbers. Here’s a number – every 1% unemployment goes up, 40,000 people die, did you know that?
I won’t dissect the accuracy of that statement here, first the math may be overstated to begin with and even then the observed increase in rates may have more to do with correlation than causation, and an analysis would be a subject for another time, but the point is clear, it ain’t good. Another to keep in mind is that it can vary widely depending at what unemployment rate we are speaking of.
A 1% unemployment rate increase when you are at 3% unemployment may be one thing (can the 97% employed in society take care of the 3% who are not), and a 1% increase when you are already at 20% unemployment may mean something else completely.
And finally, a parting update of good news. Discussed in this and prior posts, has been the importance of testing, both serology tests (to test for immunity and prior infection) as well as the more common viral tests. One very interesting US county was able to escape much of the government imposed restrictions on testing, due to some special residents it has (it is a very interesting story and worth a read) and is aiming to test everyone as I have suggested.
Today, they have released the first results of their serology testing. So to understand them, first a word about rural America, it should be no surprise that the cases being reported, in total and per capita in rural America are very low. They are places further removed from the origins of the virus, and so the last it arrived to, and also tend to have less dense conditions where a contagious virus can thrive. Many US places are still reporting 0 cases of Covid19!
San Miguel County is no exception. It has reported a total of 6 COVID19 cases (including the one reported only today!), out of a population of 8,000 people. This is despite the fact that it has been better at testing than many other similar rural counties.
But the serology test, which looks for traces of an immunological response to the virus (indicating a person had the virus in the past), is underway and the first results are out.
San Miguel County reported that 1% of the people tested so far (on Thursday and Friday) tested positive for the COVID-19 antibodies. A further 2% were indeterminate, and had an increased chance of turning positive.
Taking the mid-point between the 1% concretely positive, and the 3% potentially positive, we have 2% of the population in the middle of sparsely populated Colorado having already contracted and defeated the virus! Sound small? 2% of the county’s population is 160 cases, compared to the 6 official cases!
That is only 26.7 times more cases than previously thought!
And if it turns out that it is 3% instead of only 2%, then it is 240 cases rather than 6.
If this is the case in a small sparsely populated county in beautiful Colorado, what is real picture in places like New York, California, and much of Europe?
I hope time will tell.
It will not be a surprise to everyone, certainly not to those who have been reading my posts on the matter for more than 24 days. Hopefully, further data will become available that will allow all of us, especially our governments, to look at this situation with a greater sense of perspective and logic.
April 3 2020 Update
A word about the comments section.
Normally not something I would address but the very hysteria surrounding the subject as well as strong passions has invited some comments with less than a modicum of decorum. The most negative comments, namely no more than personal insults, are expected in an argument like this which goes against the grain, and show once again no more than the typical leftist emotional vitriol and their “open mindedness” which its adherents love to brag about. They are very open minded as long as you agree with them. Please consider that these comments will never make a reasoned argument, or take into account the piece as a whole, but simply attack hysterically, as this document is surely an enemy of hysteria, that is no surprise. At most, they will attack one short phrase taken out of context. Most ironically, these commentators themselves will often brag about not reading the piece. Reasoned arguments and critiques, especially from those who actually read the piece, are most welcome… nothing I enjoy more than correcting an incorrect position.
Facebook Comments
WordPress Comments
Disqus Comments